Welcome to the next Stonehill Forex Indicator Study. This research represents an investigative look into how and why some indicators work and some don’t work as well.
Increased Efficiency
We introduce indicators not included with the MT4 platform to find more efficient indicators which may yield superior results than older indicators better suited for different markets.
Our Next Indicator Choice is…
The2 Pole Super Smoother Filteris our next baseline indicator choice. This indicator was developed by John Ehlers and was discussed at length in his book “Cybernetic Analysis For Stocks And Futures”, published in 2004. His “Smoother” indicators (there are a few) are based on a concept called Butterworth Filters, which is a type of signal processing filter designed to have as flat frequency response as possible and are one of the most commonly used digital filters in motion analysis and in audio circuits.
Filtering Out Noise
For the trading world, Mr. Ehlers has been able to use the mathematical concepts of the Butterworth Filter as an alternative to the EMA (Exponential Moving Average) and SMA (Simple Moving Average) to detect trends. The indicator’s objective is to produce a smoother average with a minimum of lag by filtering out excessive market noise, and providing an indication of market direction.
Baseline Indicator
The2 Pole Super Smootherpresents as an on-chart indicator, overlaying price (See screenshot below). We consider it a “baseline indicator”. A baseline indicator falls into the category of indicators whereby it serves as an initial gatekeeper when setting up your algorithm. These concepts are explained in great detail in the Stonehill Forex Advanced CourseHERE.
Advantages
-
Single line signal
-
Possibly used an exit signal
-
Detects trends earlier than other types of indicators
Heavy Duty Math
The math behind Super Smoother filter indicators is predicated on Butterworth Filters, which served as a basis for his conversion to Multipole Smoothing Filters. The actual computations are quite complex, and a casual look at the actual source coding for the indicator makes us very appreciative that we don’t have to manually plot this on a chart! If you are indeed interested in some of his work, here is thelinkto purchase the aforementioned book. Check out page 202 for the background science behind the indicator.
Simple is the Name of the Game
Below is a screenshot of what the indicator looks like on the daily time frame. Note that we’ve changed the candles to “red” (price closed lower) and “blue” (price closed higher) in order to demonstrate the relationship between price and the indicator. We’ve also thickened the indicator line and changed it from red to white to make it more visible.
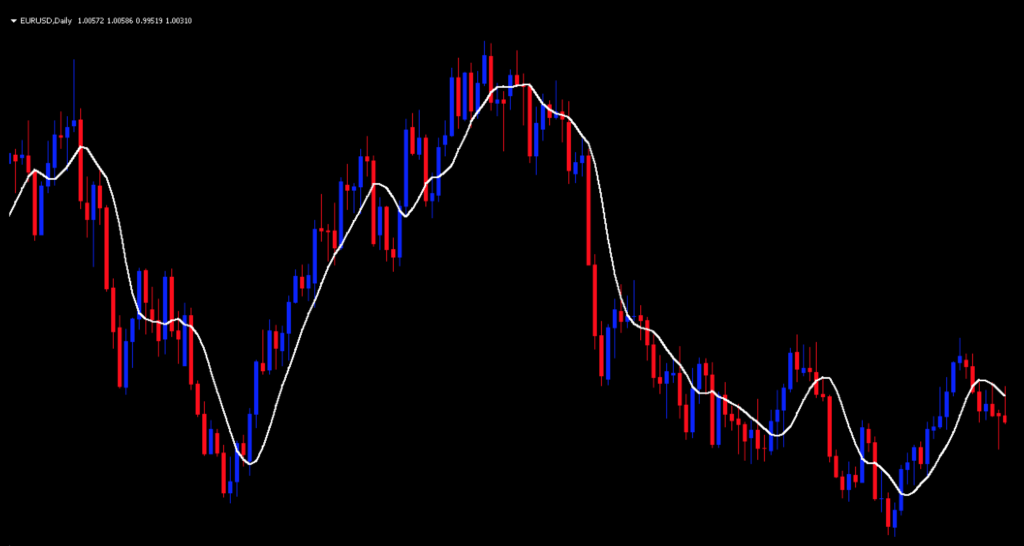
How We Use It
The signal occurs on the opening of the period following the close of the candle below (long) or above (short) the indicator line, when you see the color change.
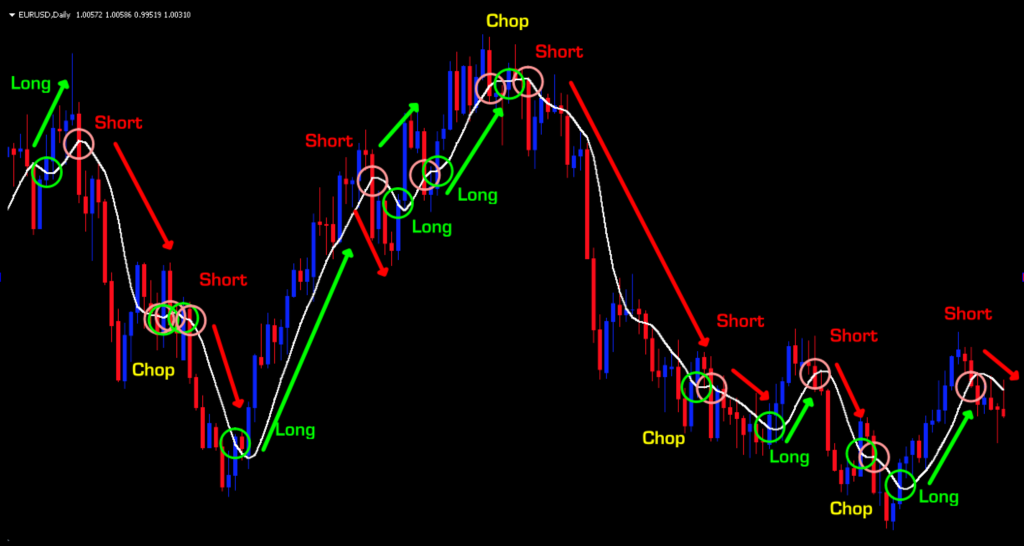
Choppy Waters
Note that on the default setting, there is “chop” as noted in yellow in the screenshot below. An effective algorithm would have kept you out of those sideways or less volatile markets; however, when a legitimate trend is in place, this indicator has the ability to signal you quite early.
Walk the Line
The irony of this indicator is that so much is going on in the background and yet, the only thing you need to concern yourself is whether price closed above or below the indicator line. How wonderfully simple is that? If you noticed, this indicator appears to “hug” price and react much quicker than other indicators based strictly on moving averages.
Below is a screenshot of the 2 Pole Super Smoother plotted with SMA and EMA lines to demonstrate Mr. Ehler’s objective.
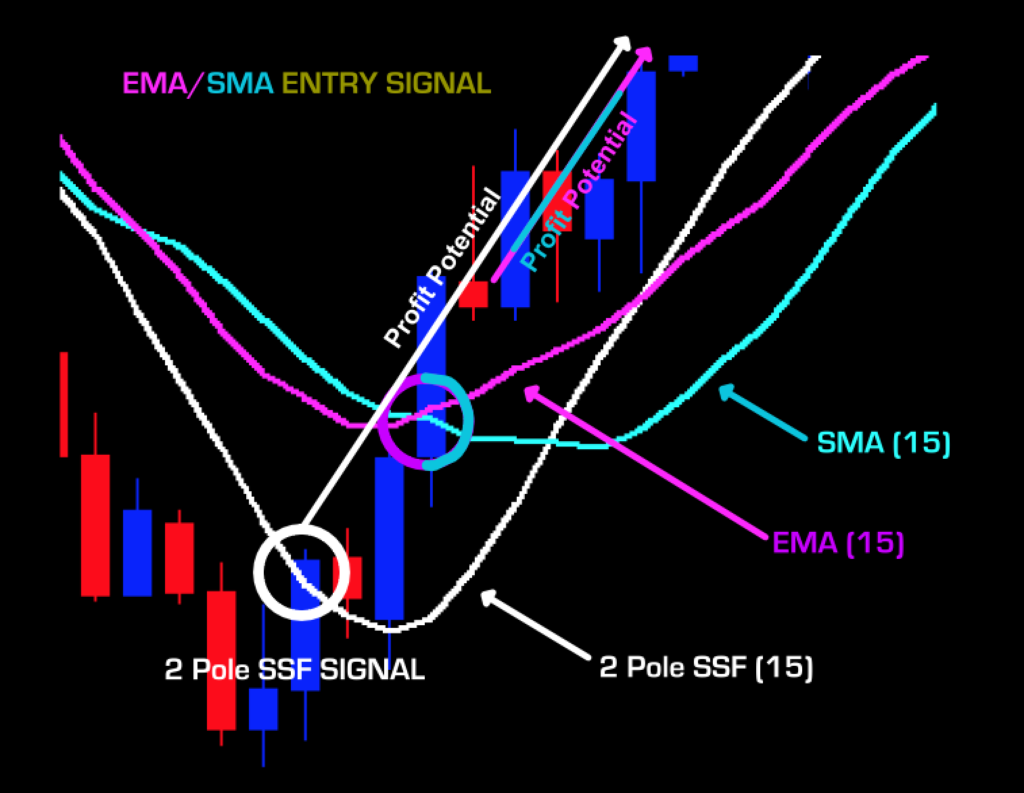
An earlier entry is clearly defined in this example and demonstrates why we continue to find newer and more accurate indicators than those which were created prior to the introduction of spot Forex market in 1996.
Signals
Long = Price closes above the indicator. Entry on next open period.
Short = Price closes below the indicator. Entry on next open period.
Settings
There is only one setting for this indicator; CutoffPeriod. The default setting is 15. This setting represents the maximum period for a wave cycle to be considered noise – something which this indicator aims to “filter” out.
Testing…Testing…Testing
Remember, comprehensive analysis is strongly suggested, and we advocate backwards and forward testing indicators or systems prior to trading actual funds. We propose conducting your tests on the following five pairs.
EUR/USD
AUD/NZD
EUR/GBP
AUD/CAD
CHF/JPY
If it doesn’t work on these five pairs, chances are it won’t work on other pairs. This is not an absolute, but we’ve found this rule is reliable in most cases.
We’ve added two other pairs to our testing sequence based on feedback we’ve received from our community. They are the:
BTC/USD (Bitcoin/US Dollar)
XAU/USD (Gold/US Dollar)
Timeframes and Results
In our initial test, we’ll run the2 Pole Super Smoother Filterindicator on the EUR/USD, the BTC/USD and XAU/USD using the default settings across the daily and 4-hour timeframes on the MT4 strategy tester. We use the fast method of testing the indicator to get a general idea; however, you may also run the tick-by-tick data set for a more precise result (which takes considerably more time).
As No Nonsense Traders – and therefore Swing Traders, we will not examine shorter time frames in these studies.We will also run an additional test, using different values for the settings, to analyze which one may work better and examine the following results:
Total trades
Win/Loss ratio
ROI (return on investment)
There are other metrics included in the strategy tester report, which can be compared, but these three metrics provide the necessary gauge to make quick decisions as to the usefulness of a particular indicator and its settings.
Next, for comparison, we’ll explore the following;
Daily – 1 year
4-hour – 3 months
The reason exceptionally long (or short) testing periods are not included is due to changing market conditions, which might return irrelevant information. A balance of statistically significant data is necessary for accurate results.
And the Outcome…
Below are the spreadsheets listing the results from our tests.


The green highlighted rows represent “basic tweaks” on the settings which returned better results. Are these the best? Not necessarily. Given that variables including testing date range and broker data are different from person to person, you may find better settings.
*NOTE: During the three-month period where we tested the both BTC/USD (Bitcoin) and XAU/USD (Gold) on the 4-hour time frame, there were no possible combination of settings that returned a positive ROI. This was first discussed in theFisher No-Repaint blogand again in VP’s corresponding indicator profileYouTube Video.
C’est La Vie
It happens. It’s okay. Some pairs move differently and indicators react differently to price over time. That’s the beauty of the Forex market. Trending, channeling, dead, and extreme volatility conditions exist…and flex over time; further proof that you should never become fixated on only a couple of pairs. Understanding this concept puts you head and shoulders above other “uninformed” traders.
Remember, the overall NNFX philosophy of taking profit, risk, and drawdown is thatYOUare creating a system whichYOUwill be trading. Don’t let anybody else take that away from you. Part of the learning process is digging in and doing the work yourself. To learn more about these topics, check out the advanced course!
That beings said, the results we post in these blogs should never be considered specific trading advice.
***Note: Remember, never use just this one indicator as your decision of whether to open or close a trade. It should be part of a system.