QQE (Quantitative Qualitative Estimation)
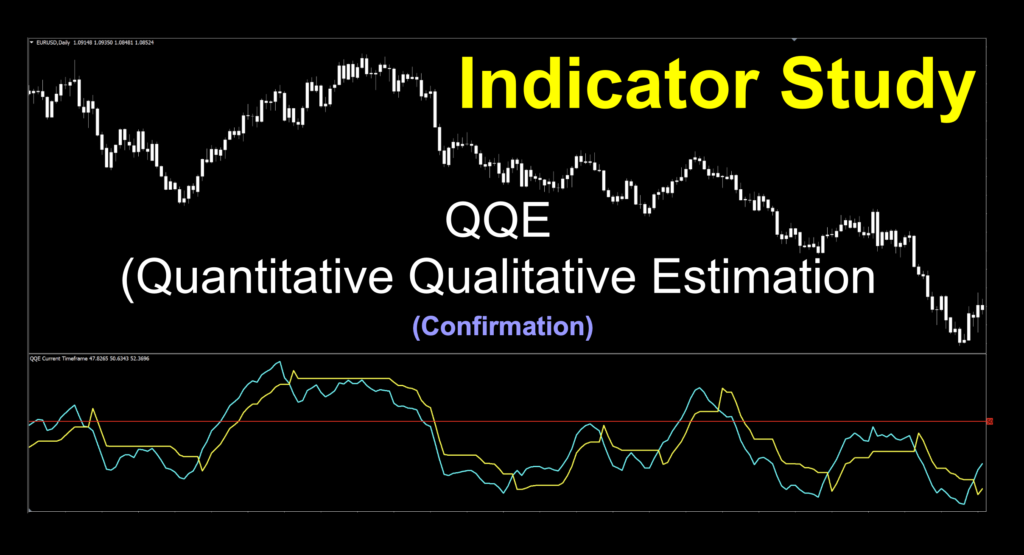
QQE, or Quantitative Qualitative Estimation, is based on the RSI (Relative Strength Index) but has some differences. This version calculates the absolute value of changes in RSI, averages them twice, and smooths them out.
Oscillating indicators, such as RSI, are often used to identify overbought and oversold conditions by adding extra levels to the indicator window. But we don't. It’s hard to determine what is truly overbought or oversold outside the stock market.
We’ll see how this version reacts to price changes and mark some entries for comparison.
Alternate Settings
We'll use the default settings for this version and changed the colors for better visualization. The candles are white to keep our focus on the indicator.
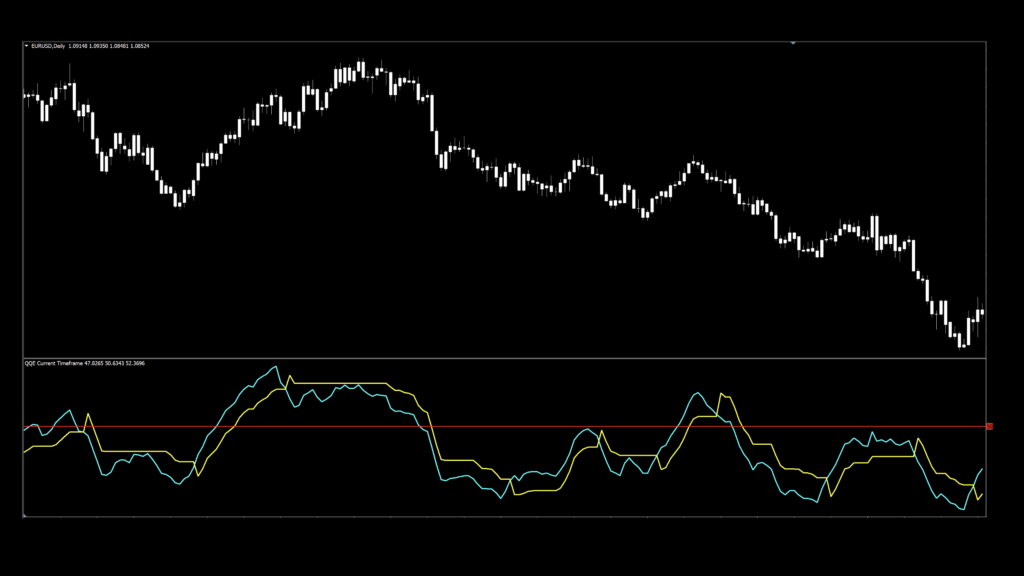
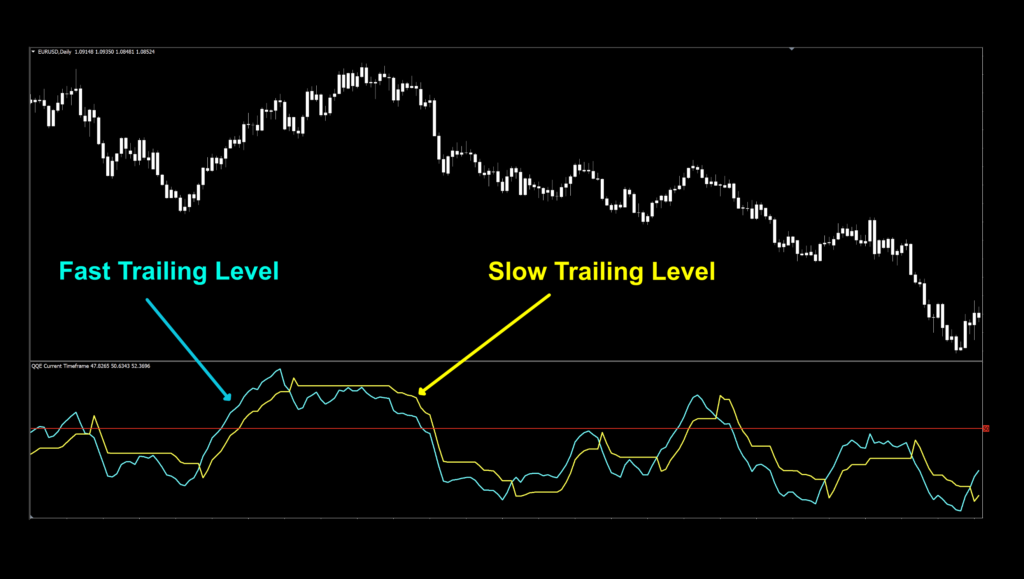
There are two lines: aqua (fast) and yellow (slow). These "trailing levels" are calculated using the ATR (Average True Range) of smoothed RSI over several periods, then further smoothed. The fast and slow ATR multipliers help create these lines.
Settings
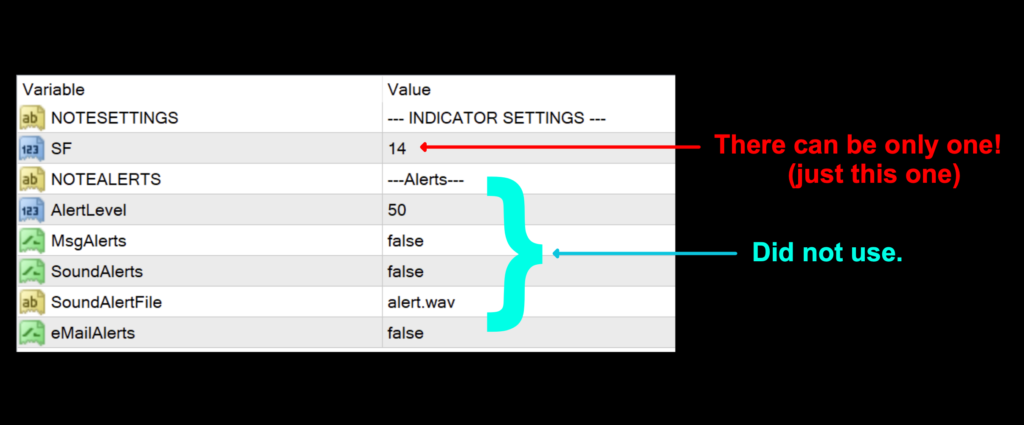
SF (Smoothing): This affects the calculations of the two lines, defaults to 5.
Advantages
* Provides different options for signals
* Easy to adjust for varying markets.
* Smoothed lines filter out market noise.
How We Use It
Two Line Versus Mid-Line
Let’s see how the two different methodologies compare.
- The pink circles represent the two line cross.
- The purple circles represent the mid-line cross. We’re taking into account the faster trailing line for our testing purposes.
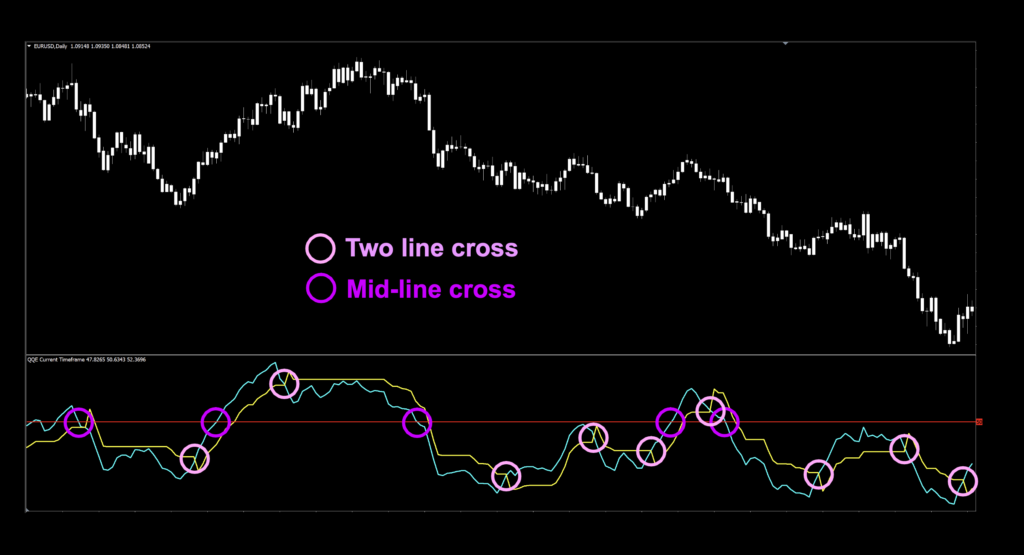
Both methodologies appear to give pretty decent signals. At first glance, it appears that the zero cross may keep you in trade longer, while the two lines cross is more reactive to change in direction of price. We’ll see how testing plays out.
Two line cross:
-
Long signal: when the aqua line crosses and closes over the yellow line. The entry occurs on the open of the next candle.
-
Short signal: when the yellow line crosses and closes over the aqua line. The entry occurs on the open of the next candle.
Mid-line cross:
-
Long signal: When the aqua line crosses and closes over the zero-line. The entry occurs on the open of the next candle.
-
Short signal: When the aqua line crosses and closes below the zero-line. The entry occurs on the open of the next candle.
Testing the QQE
We’re going to test the same indicator two different ways; 1) as a two lines cross, then 2) as a mid-line cross.
The six pairs we recommend testing are…
- EUR/USD
- AUD/NZD
- EUR/GBP
- AUD/CAD
- CHF/JPY
- CAD/SGD
1. Two lines cross


2. Mid-line cross


Analysis
As we always like to mention, green highlighted rows are the tweaks we found which returned better results – but we never post fully optimized tweaks because numbers change every day. We’re just demonstrating indicators which can be made better. The settings are not to be considered trading advice – they are for educational and illustrative purposes only.
And most importantly, do not ever use just one indicator to make your trading decisions. Always have a proven algorithm in place for better trading odds.