
Welcome Back
Welcome to the next Stonehill Forex Indicator Study. This research represents an investigative look into how and why some indicators work and some don’t work as well.
Increased Efficiency
We introduce indicators not included with the MT4 platform to find more efficient indicators which may yield superior results than many of those found as part of the “boxed set” on the trading platform.
Our Next Indicator Choice is…
TheSchaff Trend Cycleis our next confirmation indicator choice. Developed by Doug Schaff in the late 1990s but not published until 2008, this indicator’s signal line is known for reacting sooner than the MACD and is able to identify trends quicker.
Like other oscillating indicators bound between 0 and 100, the Schaff Trend Cycle indicator historically has been used to indicate a bull signal when the signal line surpasses 25 on the way up, and a bearish signal when the signal line surpasses the 75 on the way down. The version we’re looking at is easier to use since it relies on a color change, indicating upward or downward trends. Additionally, it is not bound by 0 to 100.
Caution Ghost Rider
One cautionary note; be aware that this oscillator can linger at the top or bottom (sometimes called overbought and oversold) for an extended period. As OB/OS conditions really aren’t a thing in Forex, we don’t really care where the signal line lives. We’re just interested in the color change, indicating a possible trend condition.
Confirmation Indicator
A “confirmation indicator” falls into the category of indicators that serve as an initial checkpoint after the baseline indicator. It is also a “below chart” indicator, which helps keep your price chart free of distractions. Another consideration is whether you choose to use this indicator as entry only or as an entry/exit indicator. How you decide to use it lies with your back testing and forward testing data. These concepts are explained in great detail in the Stonehill Forex Advanced Course (HERE).
Advantages
-
Schaff Trend Cycle reacts quicker to changing market conditions.
-
Change of color clearly identifies market direction.
-
No need to determine if the signal line breaks a specific value.
Easy on the eyes
Below is a screenshot of what the indicator looks like on the daily time frame. Note that we’ve changed the color of the candles to white to remove any emotional bias and that only the indicator is prominent.
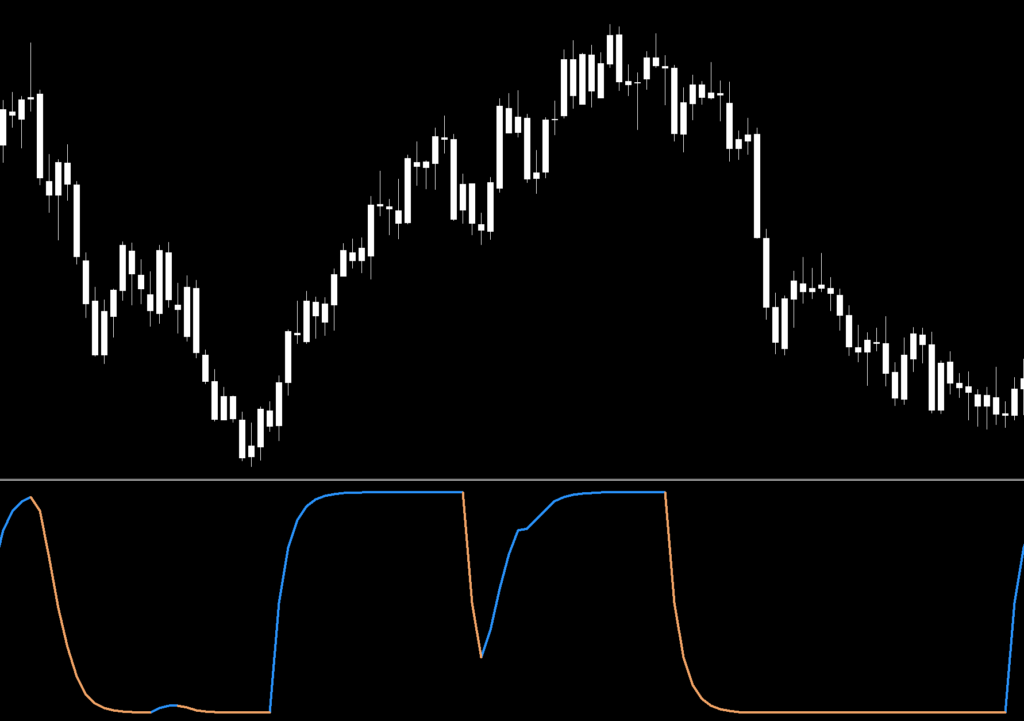
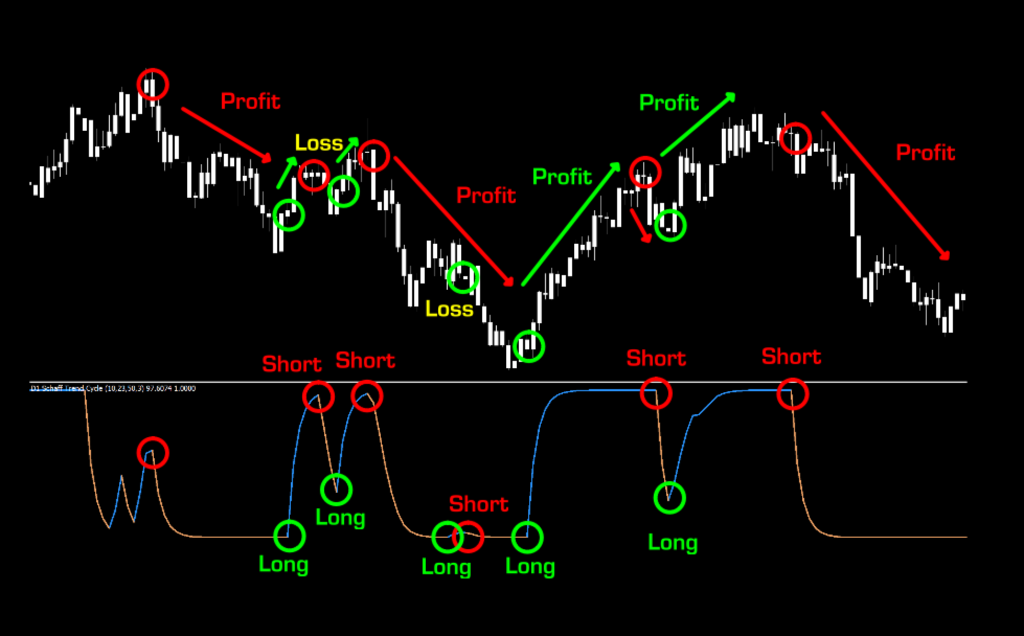
How We Use It
Simply stated, when the signal line turns from “sandy brown” to “dodger blue”, a bullish condition exists and long signal is indicated. Conversely, when the signal line turns from blue to brown, a bearish condition exists and a short signal is indicated.
Settings
The settings include; Time frame, Schaff period, fast MACD, slow MACD, Signal period, and Interpolate in multi time frame mode. The default settings are; current, 10, 23, 50, 3.0, and true. These are the settings and default values of the version we have available for download on the resource page. Some versions have slightly different default values. Before we take a closer look, I’ll explain what each parameter represents.
Time frame: Specifies which time frames the indicator will be visible. “Current” means it will be visible in whatever time frame your chart is currently set for.
Schaff period: Number of bars to use in the calculations.
Fast MACD: Also known as the “Short Cycle”, the length of the long-moving average period.
Slow MACD: Also known as the “Long Cycle”, length for the short-moving average period.
Signal period: Adjusts how choppy or smooth the signal line prints. The larger the number, the smoother the line.
Interpolate in multi time frame mode: Indicator is automatically adjusted for whatever time frame your chart is currently set for.
Testing…Testing…Testing
Remember, comprehensive analysis is strongly suggested, and we advocate backwards and forward testing indicators or systems prior to trading actual funds. We propose conducting your tests on the following five pairs.
EUR/USD
AUD/NZD
EUR/GBP
AUD/CAD
CHF/JPY
If it doesn’t work on these five pairs, chances are it won’t work on other pairs. This is not an absolute, but we’ve found this rule is reliable in most cases.
We’ve added two other pairs to our testing sequence based on feedback we’ve received from our community. They are the:
BTC/USD (Bitcoin/US Dollar)
XAU/USD (Gold/US Dollar)
Timeframes and Results
In our initial test, we’ll run theSchaff Trend CycleIndicator on the EUR/USD, the BTC/USD and XAU/USD using the default settings across the daily and 4-hour timeframes on the MT4 strategy tester. We use the fast method of testing the indicator to get a general idea; however, you may also run the tick-by-tick data set for a more precise result (which takes considerably more time).
As No Nonsense Traders – and therefore Swing Traders, we will not examine shorter time frames in these studies.We will also run an additional test, using different values for the settings, to analyze which one may work better and examine the following results:
Total trades
Win/Loss ratio
ROI (return on investment)
There are other metrics included in the strategy tester report, which can be compared, but these three metrics provide the necessary gauge to make quick decisions as to the usefulness of a particular indicator and its settings.
Next, for comparison, we’ll explore the following;
Daily – 1 year
4-hour – 3 months
The reason exceptionally long (or short) testing periods are not included is due to changing market conditions, which might return irrelevant information. A balance of statistically significant data is necessary for accurate results.
And the Outcome…
Below is a spreadsheet listing the results from our tests.


The green highlighted rows represent “basic tweaks” on the settings which returned better results. Are these the best? Not necessarily. Given that variables including testing date range and broker data are different from person to person, you may find better settings. Remember, the overall NNFX philosophy of taking profit, risk, and drawdown is thatYOUare creating a system whichYOUwill be trading. Don’t let anybody else take that away from you. Part of the learning process is digging in and doing the work yourself. To learn more about these topics, check out the advanced course!
That beings said, the results we post in these blogs should never be considered specific trading advice.
***Note: Remember, never use just this one indicator as your decision of whether to open or close a trade. It should be part of a system.