Impulse Speed
We’ve chosen theBears Bulls Impulseas our next confirmation indicator choice.This indicator is an adaptation of the Elder Ray Index indicator developed by Dr. Alexander Elder. The original version was developed in 1989 and was given the name Elder “Ray” because he felt it could see through the market, just as an X-Ray can see your bones through your skin.
Version 1.0
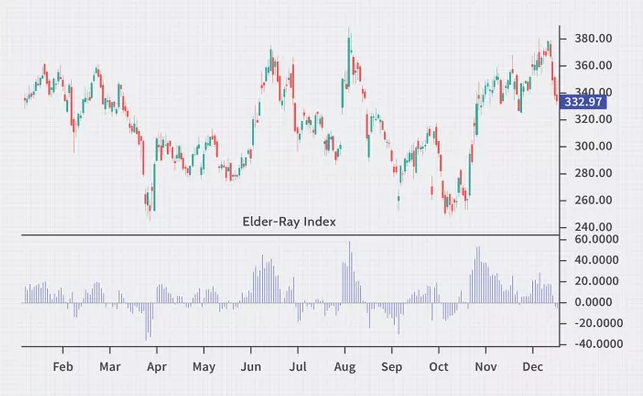
The original indicator was a histogram exhibiting an above/below zero line visual which illustrated which group was driving the market. The amplitude, or size, of the histogram bar showed the strength during that particular time period. This is what the original version looked like.
The current version as noted in this blog is a recent adaptation of the indicator, and much easier to read as it clearly defines the signal.The indicator shows as a green and red crossover, using a zero-line level as the long/short signal when the two signal lines cross.
Fun With Math
The math which creates the indicator is based on differences of exponential moving averages which tells us that it’s a lagging indicator; however, when a trend is forming, it can provide a great entry or exit signal as part of your algorithm.
Confirmation Indicator
Recall that a “confirmation indicator” falls into the category of indicators that serve as an initial checkpoint after the baseline indicator. It is also a “below chart” indicator, which helps keep your price chart free of distractions. These concepts are explained in great detail in the Stonehill Forex Advanced Course (HERE).
Advantages
Visually striking
Clear signals without confusion
Good for trend identification
A picture is Worth a Thousand Words
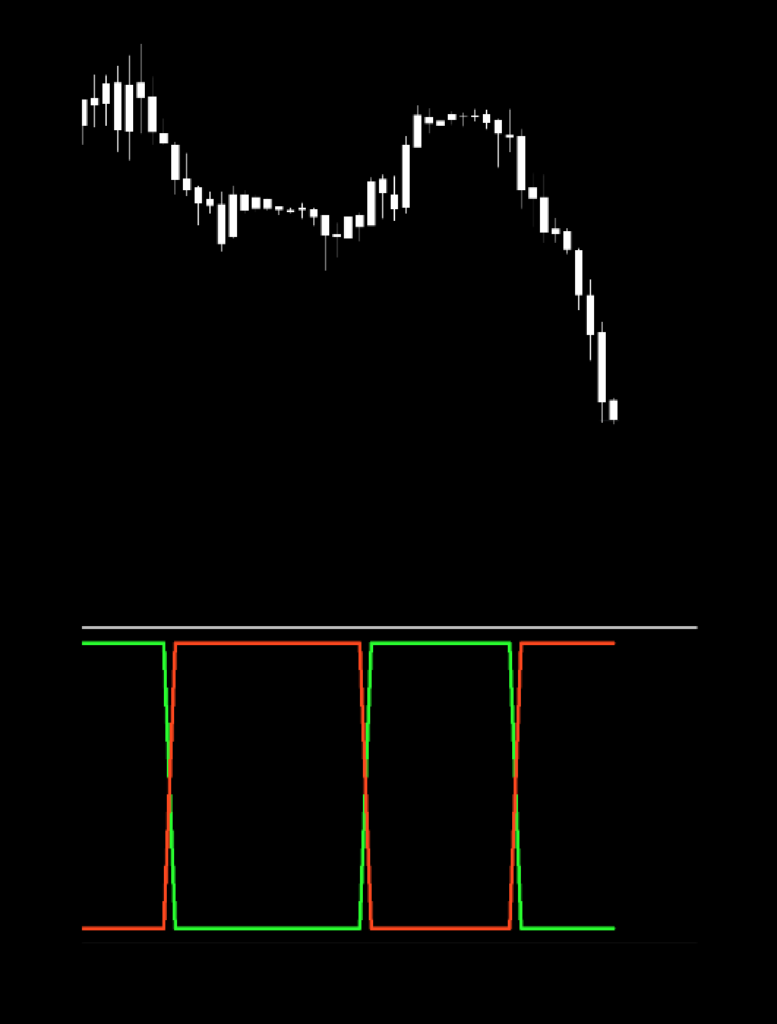
Below is a screenshot of what the indicator looks like on the daily time frame. Note that we’ve changed the color of the candles to white to remove any emotional bias so that only the indicator is prominent.
How we Use it
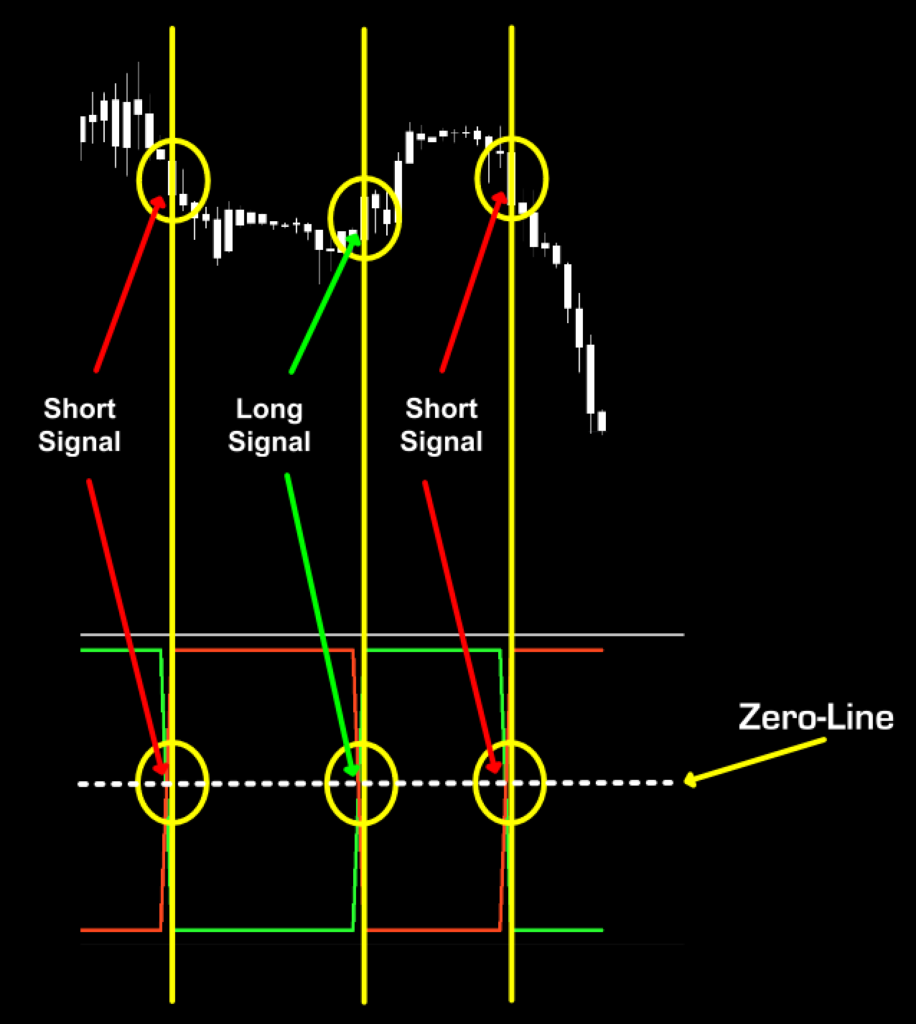
As we mentioned before, when the red and green cross at the zero line, a signal is produced;
-
Green pointing up and red pointing down = long
-
Red pointing up and green pointing down = short.
This is why this indicator can be classed as a “zero-line cross” or a “crossover” indicator. Below, is a screenshot demonstrating what the signals look like.
Settings
The setting includes; Length and Type. The default settings are 13, and 0. Even though the original indicator specified exponential moving averages, the default data set of the indicator uses simple moving averages. In actuality, it won’t matter, because we’ll be testing through all four data sets. Before we take a closer look, I’ll explain what each parameter represents.
Length: This setting controls the number of periods used to calculate the value of the signal.
Type: Represents the different types of price data to calculate the signals. In this indicator, there are four Types:
- 0 – Simple: The most basic data set, it represents simple averaging of the data.
- 1 – Exponential: Values closer to the current price are given more importance, and therefore bias the signal to more recent price action.
- 2 – Smooth: Smoothing data removes random variations and removes extreme highs and lows.
- 3 – Weighted: Similar to exponential calculations, data closer to current prices are given more importance, while older data’s importance is reduced.
Testing…Testing…Testing
Remember, comprehensive analysis is strongly suggested, and we advocate backwards and forward testing indicators or systems prior to trading actual funds. We propose conducting your tests on the following five pairs.
EUR/USD
AUD/NZD
EUR/GBP
AUD/CAD
CHF/JPY
If it doesn’t work on these five pairs, chances are it won’t work on other pairs. This is not an absolute, but we’ve found this rule is reliable in most cases.
We’ve added two other pairs to our testing sequence based on feedback we’ve received from our community. They are the:
BTC/USD (Bitcoin/US Dollar)
XAU/USD (Gold/US Dollar)
Timeframes and Results
In our initial test, we’ll run theBears Bulls ImpulseIndicator on the EUR/USD, the BTC/USD and XAU/USD using the default settings across the daily and 4-hour timeframes on the MT4 strategy tester. We use the fast method of testing the indicator to get a general idea; however, you may also run the tick-by-tick data set for a more precise result (which takes considerably more time).
As No Nonsense Traders – and therefore Swing Traders, we will not examine shorter time frames in these studies.We will also run an additional test, using different values for the settings, to analyze which one may work better and examine the following results:
Total trades
Win/Loss ratio
ROI (return on investment)
There are other metrics included in the strategy tester report, which can be compared, but these three metrics provide the necessary gauge to make quick decisions as to the usefulness of a particular indicator and its settings.
Next, for comparison, we’ll explore the following;
Daily – 1 year
4-hour – 3 months
The reason exceptionally long (or short) testing periods are not included is due to changing market conditions, which might return irrelevant information. A balance of statistically significant data is necessary for accurate results.
And the Outcome…
Below is a spreadsheet listing the results from our tests.


The green highlighted rows represent “basic tweaks” on the settings which returned better results. Are these the best? Not necessarily. Given that variables including testing date range and broker data are different from person to person, you may find better settings. Remember, the overall NNFX philosophy of taking profit, risk, and drawdown is thatYOUare creating a system whichYOUwill be trading. Don’t let anybody else take that away from you. Part of the learning process is digging in and doing the work yourself. To learn more about these topics, check out the advanced course!
That beings said, the results we post in these blogs should never be considered specific trading advice.
***Note: Remember, never use just this one indicator as your decision of whether to open or close a trade. It should be part of a system.