Welcome to the next Stonehill Forex Indicator Study. This research represents an investigative look into how and why some indicators work and some don’t work as well.
Increased Efficiency
We introduce indicators not included with the MT4 platform to find more efficient indicators which may yield superior results than older indicators better suited for different markets.
Our Next Indicator Choice is…
TheSuper Trendis our next confirmation indicator choice. This indicator was developed by Olivier Saban, a French trader, and promoted in his 2006 book “Tout le monde mérite d’être riche”. There are multiple variations available online with various degrees of control and modifications (i.e. changes); however, we’ll take a look at the original. By creating an indicator that utilizes our favorite indicator – the ATR (Average True Range), he was able to identify trends early in the market which are quite clear on a chart, as we’ll see below.
Confirmation Indicator
The “confirmation indicator” falls into the category of the indicators that serve as an initial checkpoint after the baseline indicator. It is an on-chart indicator, overlaying price (see snapshot below). These concepts are explained in great detail in the Stonehill Forex Advanced Course:HERE.
Advantages
- Single line signal
*Easy to identify long/short trends
*Makes a good exit signal
Calculations are the Answer
Up = (high + low) / 2 + multiplier x ATR
Down = (high + low) / 2 – multiplier x ATR
Calculation of Average True Range
[(Prior ATR x 9) + Current TR] / 10*
*Assumes that period is 10
The three steps to calculate the values are:
-
Calculate the “True Range”.
-
Calculate the median price of the most current candle.
-
Utilize a “multiplier”. This factor represents the number of times you add the ATR to the last candle’s median price.
So Simple
Below is a screenshot of what the indicator looks like on the daily time frame. Note that we’ve changed the candles to “white” in order to remove any bias. We’ve also thickened the indicator line to make it more visible.
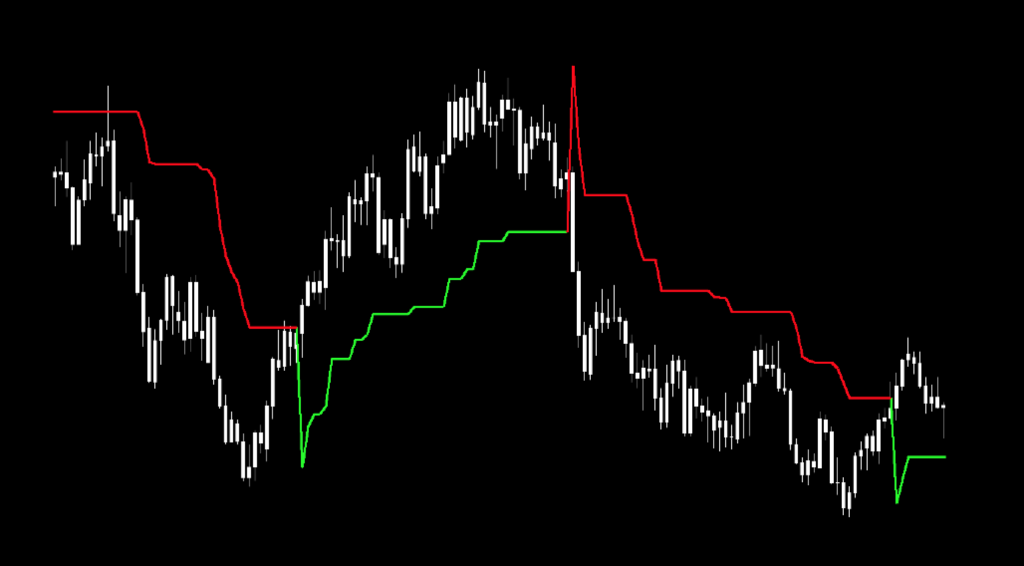
How We Use It
The signal occurs on the opening of the period following the close of the candle below (long) or above (short) the Super Trend line, when you see the color change.
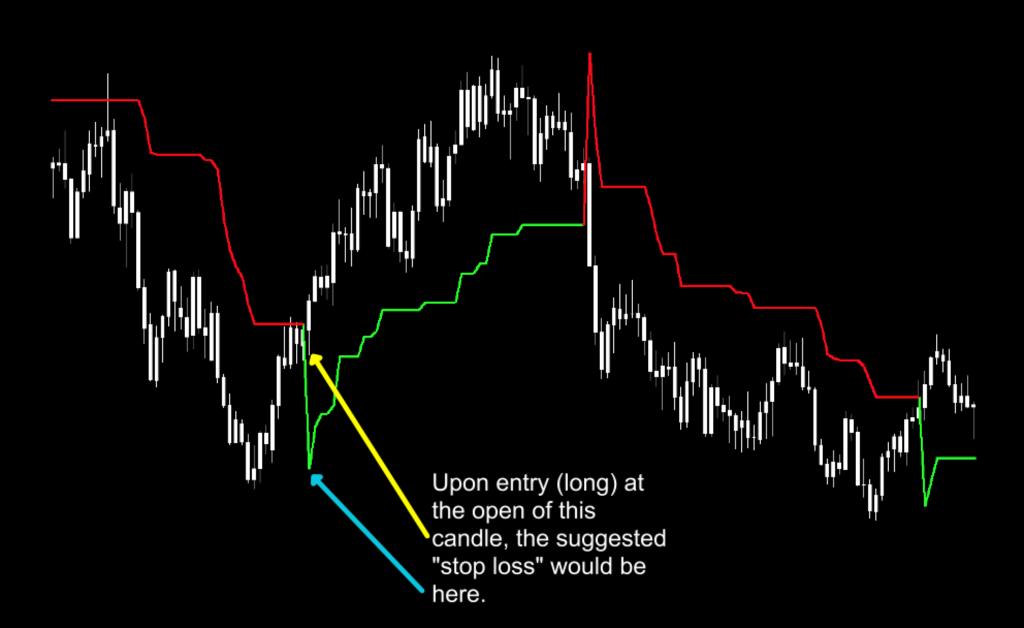
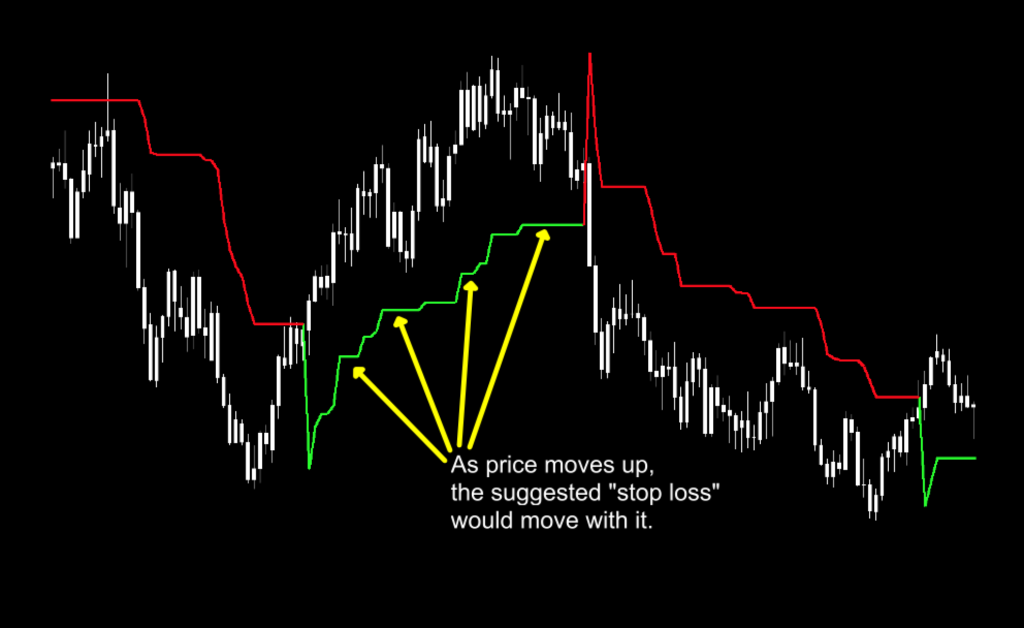
During our research, it was suggested that the line itself may be used to provide a stop loss level or as a point of price reversal; however, since we don’t advocate those methods in our trades, you can ignore those aspects of the indicator as noted in the screenshots below.
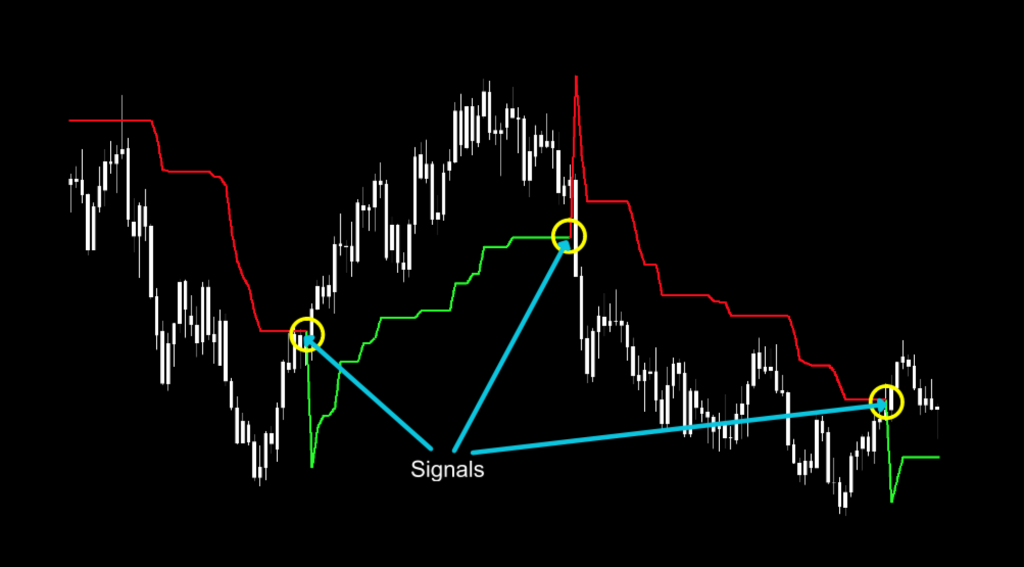
Signals
*Long = Super Trend indicator changes from Red to Green. Entry on open of next candle
- Short = Super Trend indicator changes from Green to Red. Entry on open of next candle
Settings
The settings include; “nbr_Periods” and “Multiplier”. The default settings are; 10 and 3.0. Before we take a closer look, I’ll explain what each parameter represents.
Period: The number of periods used to calculate the ATR.
Multiplier: Changes the “sensitivity” to price change. Shorter values create more signals and quicker reactivity to price changes. Longer values may distort the True Range values, which can result in less signals.
Testing…Testing…Testing
Remember, comprehensive analysis is strongly suggested, and we advocate backwards and forward testing indicators or systems prior to trading actual funds. We propose conducting your tests on the following five pairs.
EUR/USD
AUD/NZD
EUR/GBP
AUD/CAD
CHF/JPY
If it doesn’t work on these five pairs, chances are it won’t work on other pairs. This is not an absolute, but we’ve found this rule is reliable in most cases.
We’ve added two other pairs to our testing sequence based on feedback we’ve received from our community. They are the:
BTC/USD (Bitcoin/US Dollar)
XAU/USD (Gold/US Dollar)
Timeframes and Results
In our initial test, we’ll run theSuper Trendindicator on the EUR/USD, the BTC/USD and XAU/USD using the default settings across the daily and 4-hour timeframes on the MT4 strategy tester. We use the fast method of testing the indicator to get a general idea; however, you may also run the tick-by-tick data set for a more precise result (which takes considerably more time).
As No Nonsense Traders – and therefore Swing Traders, we will not examine shorter time frames in these studies.We will also run an additional test, using different values for the settings, to analyze which one may work better and examine the following results:
Total trades
Win/Loss ratio
ROI (return on investment)
There are other metrics included in the strategy tester report, which can be compared, but these three metrics provide the necessary gauge to make quick decisions as to the usefulness of a particular indicator and its settings.
Next, for comparison, we’ll explore the following;
Daily – 1 year
4-hour – 3 months
The reason exceptionally long (or short) testing periods are not included is due to changing market conditions, which might return irrelevant information. A balance of statistically significant data is necessary for accurate results.
And the Outcome…
Below are the spreadsheets listing the results from our tests.


The green highlighted rows represent “basic tweaks” on the settings which returned better results. Are these the best? Not necessarily. Given that variables including testing date range and broker data are different from person to person, you may find better settings.
Remember, the overall NNFX philosophy of taking profit, risk, and drawdown is thatYOUare creating a system whichYOUwill be trading. Don’t let anybody else take that away from you. Part of the learning process is digging in and doing the work yourself. To learn more about these topics, check out the advanced course!
That beings said, the results we post in these blogs should never be considered specific trading advice.
***Note: Remember, never use just this one indicator as your decision of whether to open or close a trade. It should be part of a system.