TTMS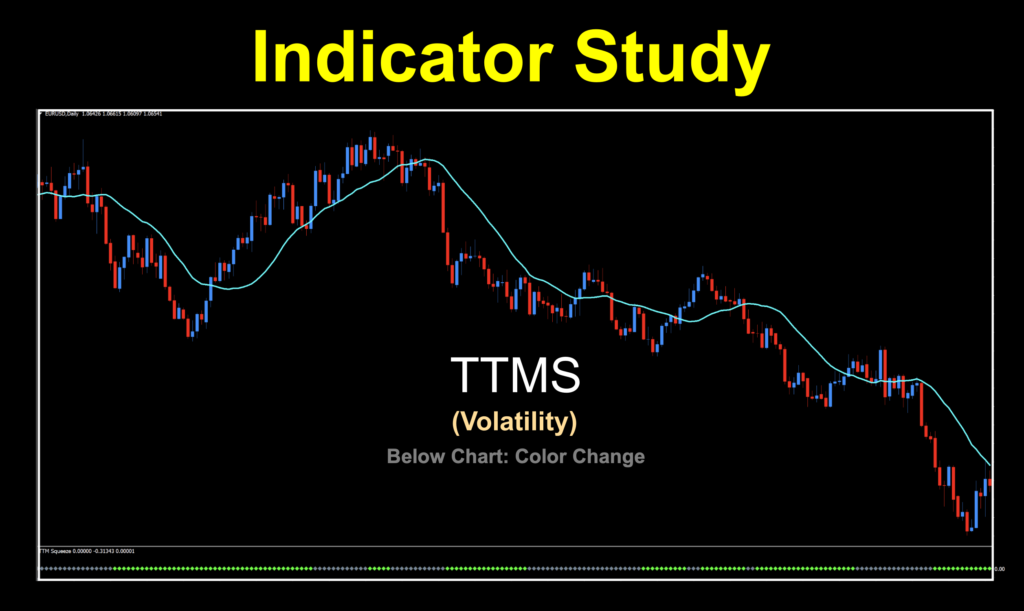
Hug and a Squeeze
Who doesn’t love a squeeze? Significant other, best friend…lottery official? We’ve got something that could be a new favorite squeeze. And the coolest thing is that it comes from a place we never thought to look. So go pick some flowers, step into your blue suede shoes, and get your squeeze on.
Not That Guy
The name’s Carter, John Carter. Founding father of the Simpler Trading Company and all around good guy. There’s one other famous John Carter, but that’s not him.

But that would be pretty cool. Barsoom! Anyway…
What’s the Deal
The deal of this indicator is that it takes older components, puts them together and creates something new. The concept of the TTMS (also known as Trade The Market Squeeze) comes from Mr. Carter’s mind in 2004 and the MT4 version we’re using is from 2013. There are different versions for multiple platforms, but we chose the one which appeared to represent the original concept.
Components
There are two main components to this indicator; Bollinger Bands and Keltner Channel. We’ll speak to these briefly but understand that we as NNFX traders generally don’t use bands or channels, which makes the TTMS very interesting to us.
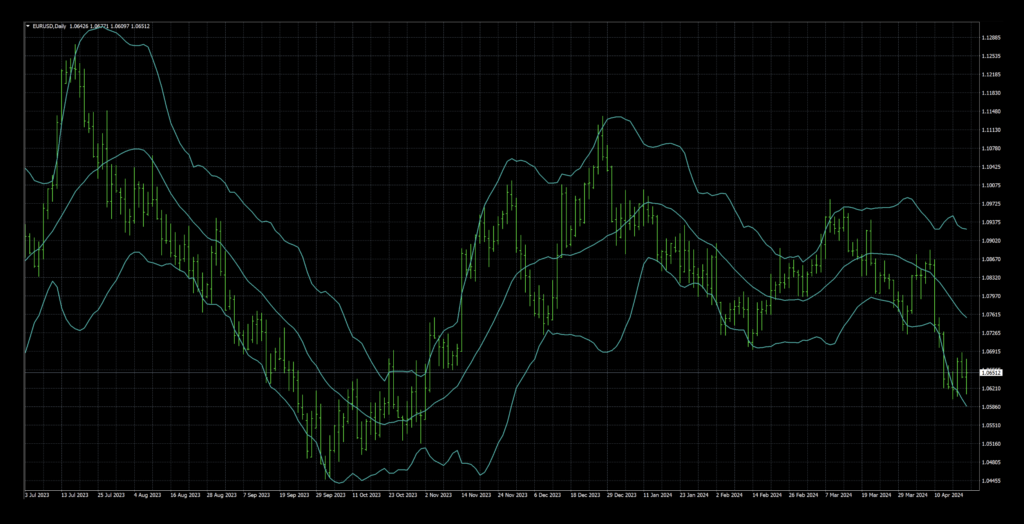
Keltner Channel
We’ll touch on Keltner Channel first, as it’s older. Introduced in the 1960s by Chester Keltner, his version used the SMA and a high/low price range to calculate the channel. The formula was later updated in the 1980s to use the ATR, which is what is used today.
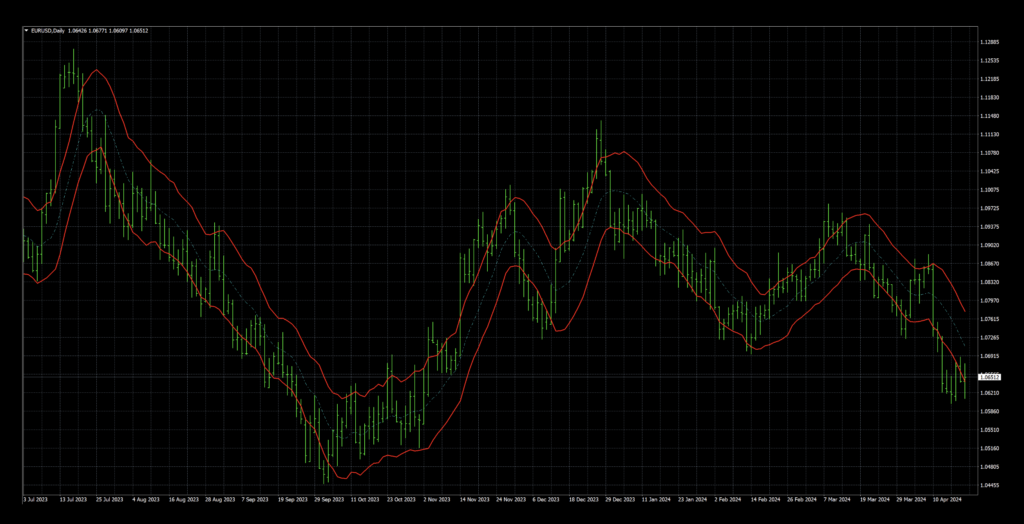
Bollinger Bands
The second component of the TTMS comes from John Bollinger’s creation from the 1980s, which uses the SMA in conjunction with the standard deviation of that moving average to create his “bands”.
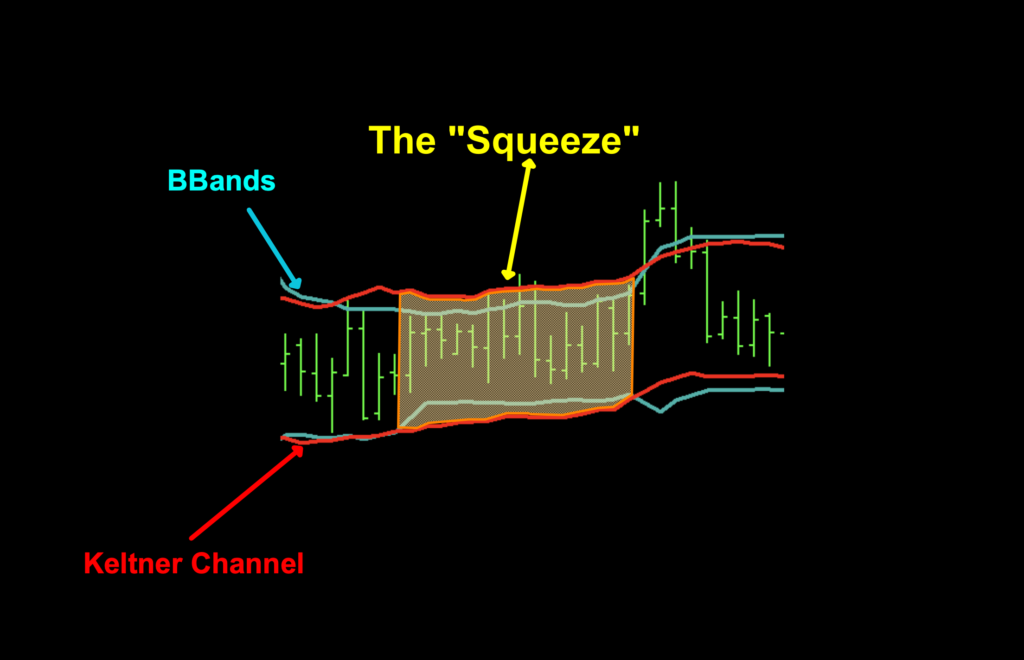
Where’s The Squeeze
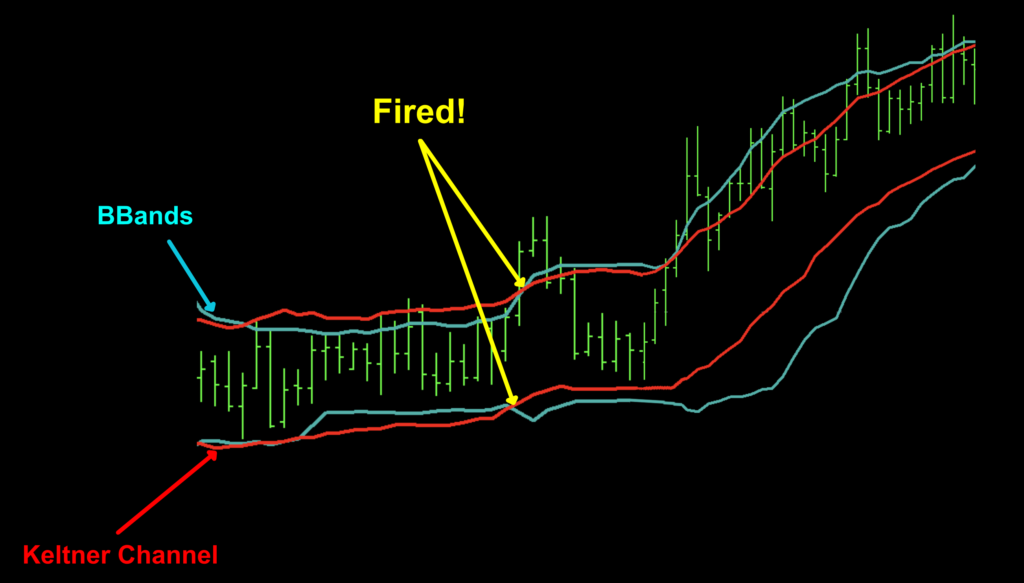
So, back to the TTMS. The “squeeze” comes from compression of both top and bottom BBands when they reside inside the Keltner Channel. This indicates low volatility in the market when price tends to become range bound and moves sideways. An image of this phenomenon can be found below.
It’s during these periods that you’ll not be trading. Looking at other pairs, spring-cleaning your attic, weeding your petunia flower bed, or finding something other than opening a trade on whatever market doesn’t indicate sufficient volatility for a higher degree of confidence.
Fired

What we’re looking for is when the BBands expand back outside the Keltner Channel. This is when the squeeze is said to have “fired” and price has a higher percentage of breaking out one way or the other into what will hopefully develop as a trend.
Let’s Go Default
When you load up the indicator, it will have a lot more than you need or want. We brightened up the colors a bit, just so you can see the difference when we change the visuals for our volatility charting purposes.
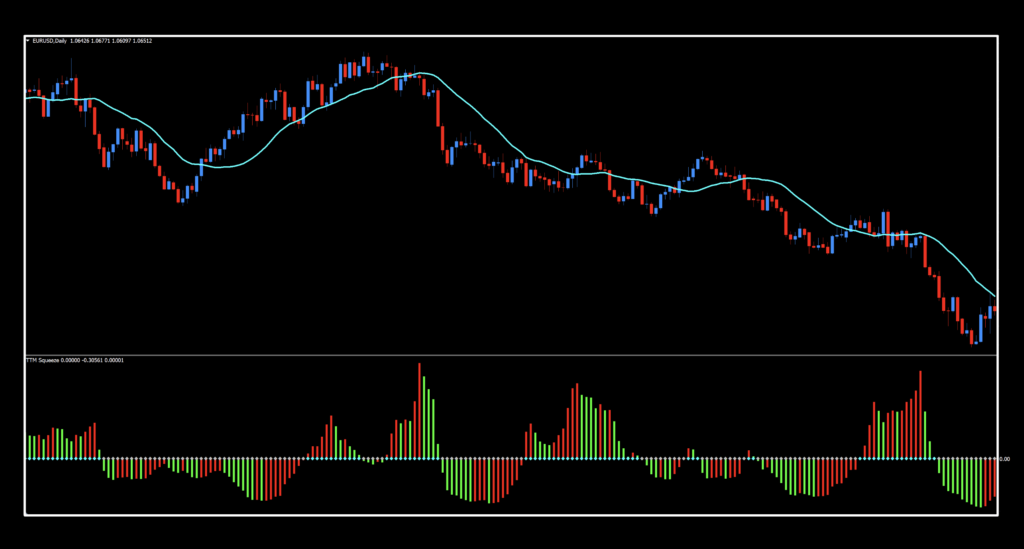
So, what do we see? Well, we see a red and green histogram, some blue, and gray dots on the zero line. What we’re going to do is get rid of the histogram and change the colors of the dots. What we’re left with is a below chart color change. The blue line over price was added and has nothing to do with the indicator. We’ll talk about that more shortly.
Here to There
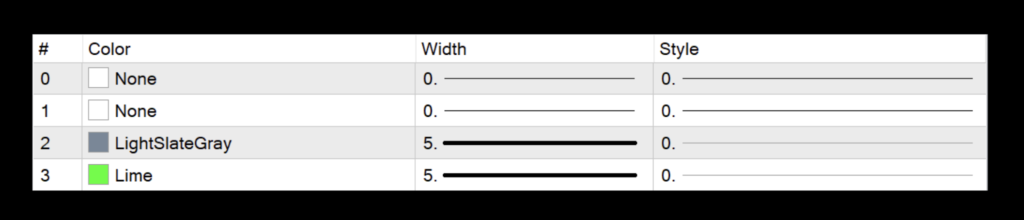
We made a few changes to the colors in the settings menu. The default colors looked like this.
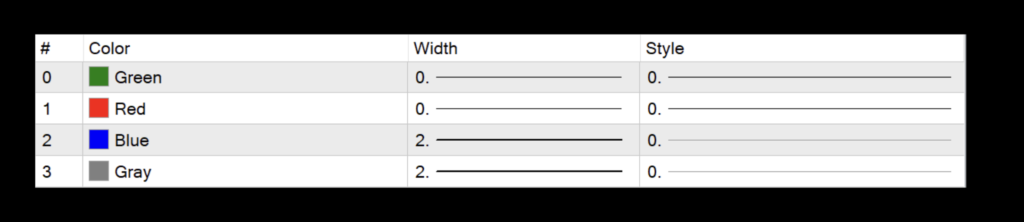
For our purposes, we changed them to this (note the width changes as well).
Thin Blue Line
By the way, the blue line over price is the trusty SMA(20) we used to test volume and volatility indicators. Naturally, you can change that to whatever color you want. We chose “aqua” because it stands out. That’s it, no special reason.
Settings
We’ll go through the settings now, but there is a particular something added which was required for us to test it. Don’t worry, we’ll explain it.
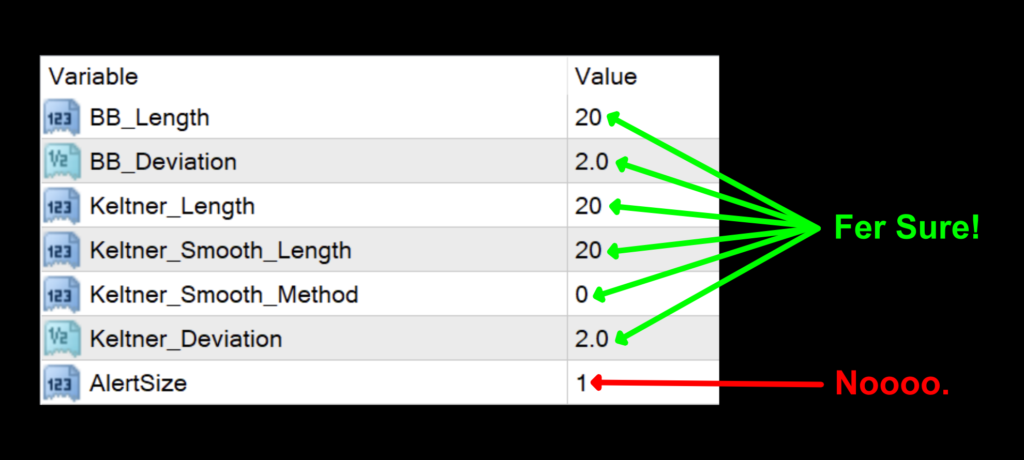
BB_Length: The number of periods for the overall BBand calculations. The default value is 20.
BB_Deviation: The degree of deviation applied to the BBand. The default value is 2.0.
Keltner_Length: The number of periods for the Keltner Channel calculations. The default value is 20.
Keltner_Smooth_Length: This is the number of periods used by the Keltner Channel smoothing function. The default value is 20.
Keltner_Smooth_Method: The type of moving average used for smoothing. 0=Simple, 1=Exponential, 2=Smoothed, and 3=Linear Weighted. The default value is Simple.
Keltner Deviation: The degree of deviation applied to the Keltner Channel. The default value is 2.0.
AlertSize
Let’s talk about that last setting, the particular something extra; “AlertSize”. Just leave it alone. It was added as a necessity for us to test this indicator. We sought help from Rui, the architect of the NNFX Algo Tester software, when all attempts failed to produce the necessary testing data. It turns out that buffer zero and null values are something that the MT4 strategy tester didn’t handle well. But, we got it fixed, so now you can test it yourself. Thanks, Rui! That tweaked version of the indicator can only be found in the library on the Stonehill Forex website…and nowhere else.
Whatcha Look Like
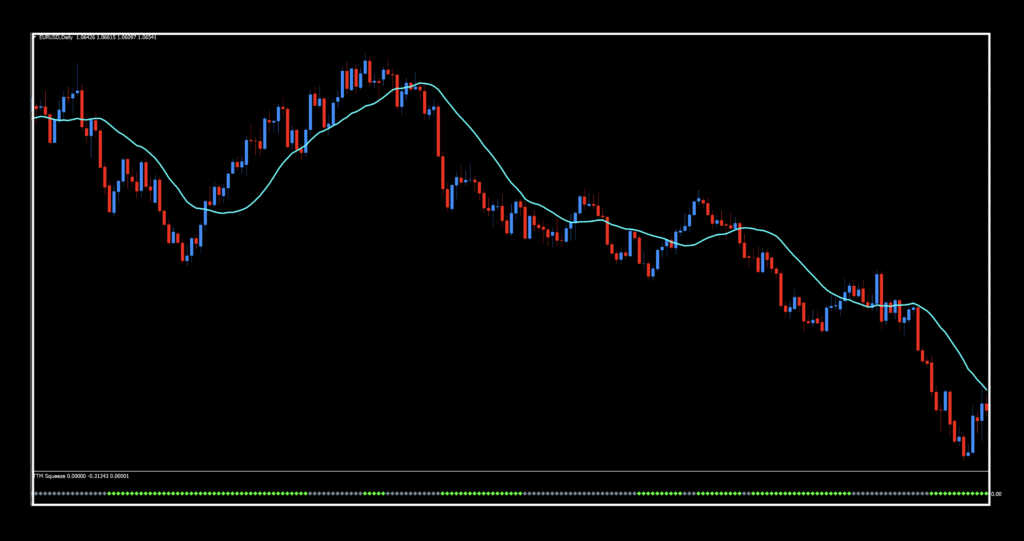
Okay, now that we’ve been through the journey, let’s see where the trade zones are.
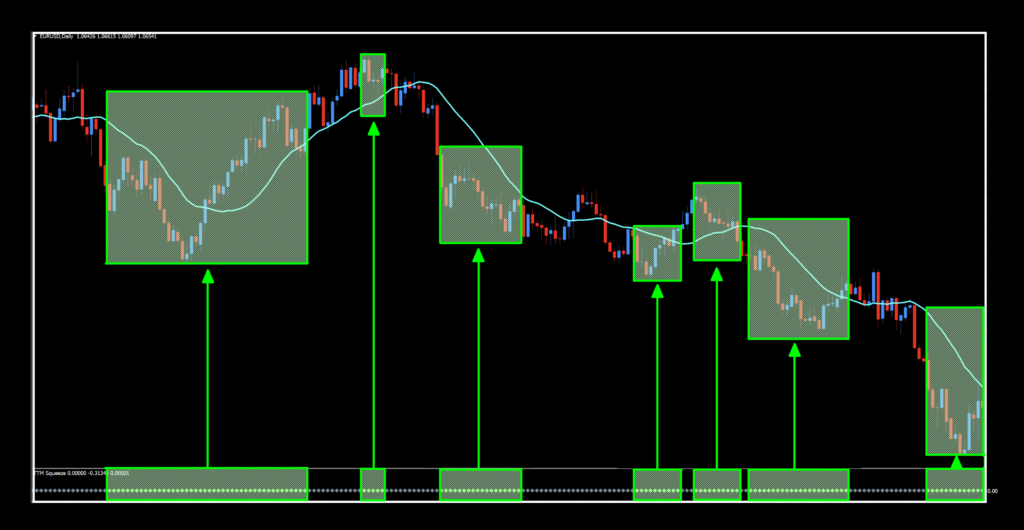
So now we have the trade zones identified by the green dots in the below chart window and arrows pointing to their associated areas in the price window. If it ain’t green, ignore it. So the process is; The BL, C1, and C2 give you go signals, THEN you look down. If you see the green, pull the trigger. If it’s gray, then go about and do something else. See what we mean below.
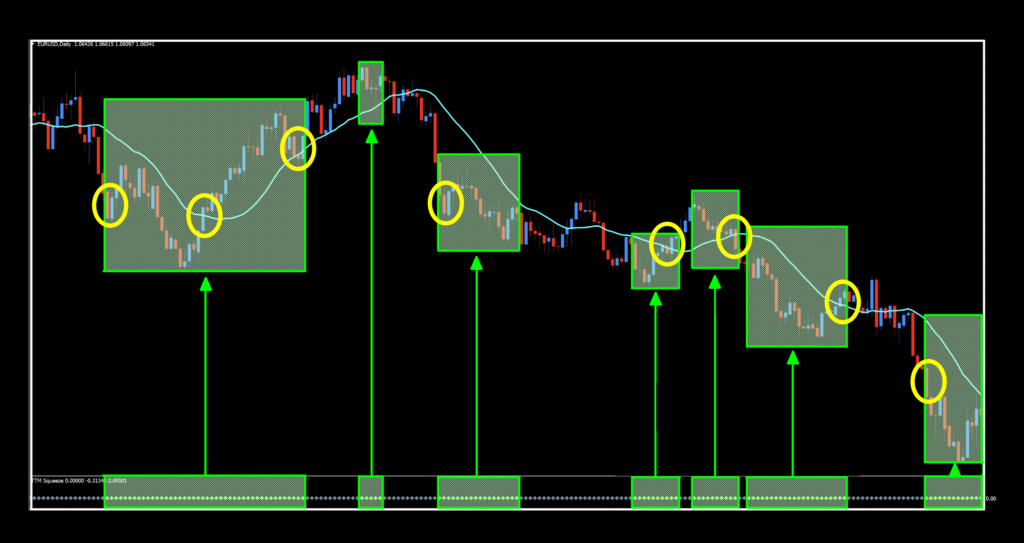
Escape the Squeeze


Choices
Before we get into the results, remember that this indicator just identifies favorable conditions for trades. It does not provide actual trade signals. That being the case, the results are really not an “apples to apples” comparison because the SMA20 may not be the best baseline to use. But that’s totally cool. Given that we’re using an old standby, the numbers were pretty solid. BTC and XAU did nicely considering the current market, and even the EUR scored well enough to warrant further investigation. SPX500 was a little soft, but nothing new, so…messy hair, don’t care. It’s been a minute since we’ve done a volatility indicator, so one more tool for your traders’ toolbox. Go have some fun!
Resources
You can get the modified indicator from the on-line library for free. When you’re ready to get it, click HERE. Be sure to subscribe to the Stonehill Forex YouTube channel for the technical analysis videos. Sign up for the Advanced NNFX Course HERE.
Our only goal is to make you a better trader.
*Our published testing results are based on money management strategies employed by the NNFX system and depend on varying external factors, which may be different between individuals and their specific broker conditions. No guarantee, trading recommendations, or other market suggestions are implied. Your results and subsequent trading activities are solely your own responsibility.
BTW — Any information communicated by Stonehill Forex Limited is solely for educational purposes. The information contained within the courses and on the website neither constitutes investment advice nor a general recommendation on investments. It is not intended to be and should not be interpreted as investment advice or a general recommendation on investment. Any person who places trades, orders or makes other types of trades and investments etc. is responsible for their own investment decisions and does so at their own risk. It is recommended that any person taking investment decisions consults with an independent financial advisor. Stonehill Forex Limited training courses and blogs are for educational purposes only, not a financial advisory service, and does not give financial advice or make general recommendations on investment.