[et_pb_section fb_built=”1″ _builder_version=”4.16″ background_image=”etl/posts/vortex-indicator-as-a-confirmation-indicator/hidden_images/Screen-Shot-2021-09-20-at-1.33.56-PM.png” global_colors_info=”{}”][et_pb_row _builder_version=”4.16″ background_size=”initial” background_position=”top_left” background_repeat=”repeat” custom_padding=”||26px|||” global_colors_info=”{}”][et_pb_column type=”4_4″ _builder_version=”4.16″ custom_padding=”|||” global_colors_info=”{}” custom_padding__hover=”|||”][et_pb_text _builder_version=”4.17.4″ background_color=”RGBA(0,0,0,0)” background_enable_image=”off” background_position=”top_left” custom_padding=”||0px|||” inline_fonts=”Roboto,Abril Fatface” global_colors_info=”{}”]
Welcome to the next Stonehill Forex Indicator Study. This research represents an investigative look into how and why some indicators work and some don’t work as well.
Increased Efficiency
We introduce indicators not included with the MT4 platform to find more efficient indicators which may yield superior results than many of those found as part of the “boxed set” on the trading platform.
Our Next Indicator Choice is…
Vortex Indicator,is our next confirmation indicator choice. The Vortex Indicator (VI) is composed of two lines; an uptrend line (VI+) and a downtrend line (VI-). These two oscillating lines work by identifying both positive and negative trend movement, creating a point of intersection. This intersection of both lines creates either a long or short signal.
No Mystical Creatures Allowed
Our research discovered that some traders attempt to use this indicator as a tool to spot trend reversals; however, as NNFX traders, we do not subscribe to the wizardry of calling tops and bottoms and rely on our ability to confirm trends. Remember, we can only trade what we see, not what we try and predict. We are not warlocks with mystical insight to foretell what might happen in the future.
A Brief History
The Vortex Indicator was developed in 2009 by two gentlemen; Etienne Botes and Douglas Seipman who first brought it to light in the Technical Analysis of Stocks & Commodities magazine. Their goal was to create an indicator tied more towards time reactivity and not subjected to excessive lagging or unreasonable sensitivity.
Their work was inspired partly by J. Welles Wilder’s Directional Movement Indicator (which will be profiled as a future blog and video) to best identify a more accurate way of identifying trend direction and notable price movement in markets. Wilder summed up the individual relationship between price periods as “Directional movement is the largest part of today’s range that is outside yesterday’s range.”
Blast From the Past
Mr. Wilder wasn’t their only well of inspiration. Mr. Botes and Mr. Seipman found relevant material from a much older source; Viktor Schauberger’s (1885-1958) “Implosion Technology” concept, which sought to apply nature’s power processes to man-made machines through fluidic vortexes observations in rivers and streams. Who knew a simple two colored crossover indicator could have such noble beginnings? If you’d like to read more about the Vortex Engine, click HERE for a brief academic article.
Let’s Do Us Some Math!
Before we get into the indicator itself, let’s look at the math for a moment to see how all that history came together, so we as retail traders might profit from it. The calculation of the indicator is divided into four distinct parts.
1. The True range is the greatest of:
Current high minus current low
Current high minus previous close
Current low minus previous close
2. Uptrend and downtrend movement:
VM+ = Absolute value of current high minus prior low
VM- = Absolute value of current low minus prior high
3. Parameter length (n):
Sum the last n period’s true range, VM+ and VM-
Sum of the last n periods’ true range = SUM TRn
Sum of the last n periods’ VM+ = SUM VMn+
Sum of the last n periods’ VM- = SUM VMn−
4. And the last part, create both the indicator lines; VI+ and VI-:
SUM VMn+/SUM TRn = VIn+
SUM VMn-/SUM TRn = VIn−
Repeating this process on whatever time frame you’re currently on forms the VI+ and VI- indicator lines. Thankfully, our computers can calculate and plot the indicator in the blink of an eye. Can you imagine manually crunching the data and drawing those lines on graph paper?
Remember, a “confirmation indicator” falls into the category of indicators that serve as an initial checkpoint after the baseline indicator provides you with a foundational signal. You’ll also notice that the Vortex Indicator is a “below chart” indicator, which helps keep your price chart free of those bothersome distractions. These concepts are explained in great detail in the Stonehill Forex Advanced Course HERE.
Advantages
-
Two lines create clear signals without confusion
-
Identifies when a new trend is starting
-
Can be used as an entry and exit signal
Outstanding!
Below is a screenshot of what the indicator looks like on the daily time frame. Note that we’ve changed the color of the candles to white to remove any emotional bias and that only the indicator is prominent. We’ve also brightened up the “blue” and “red” and made the lines a little thicker to make it easier to see for our testing purposes.
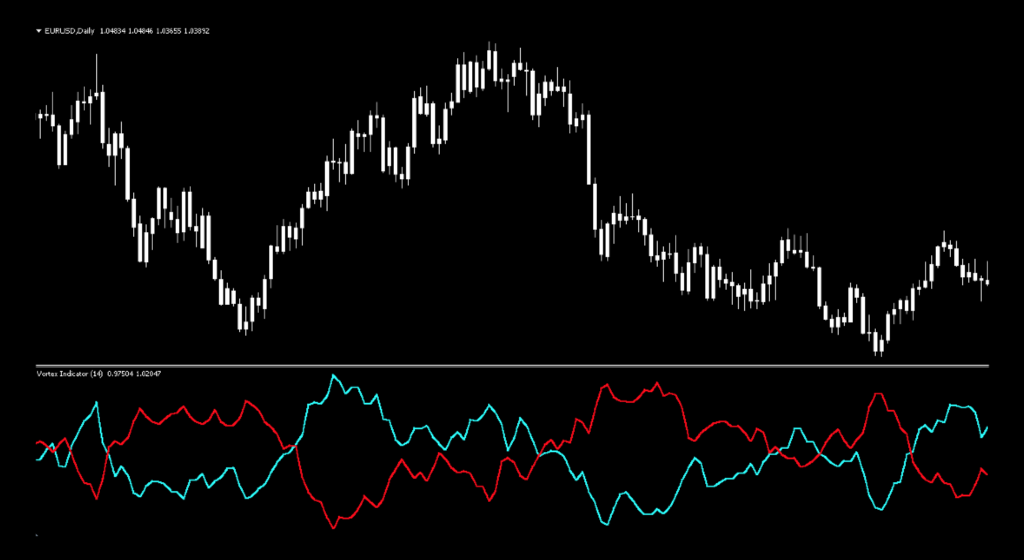
How We Use It
As a two indicator lines converge, they cross, creating the signal; blue over red – long and red over blue – short. Conversely, if you considered using this indicator as an exit signal, the opposite of your entry would apply.
Things Can Get Choppy
Moreover, it should be noted that choppy price action may result in a number of false signals. A simple solution is to increase the number of periods used in the indicator. Let’s take a look at a chart with the signals mark up.
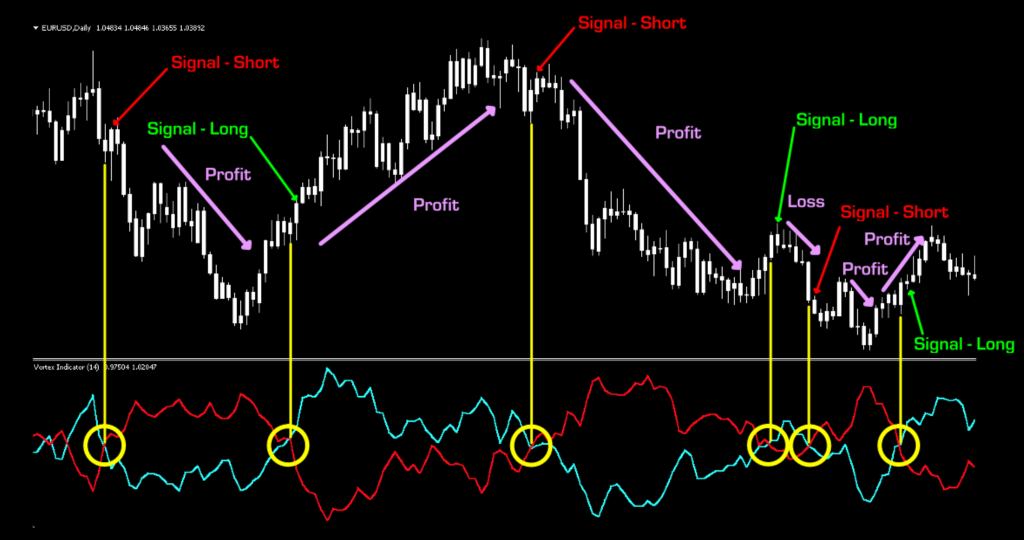
Signals
Long = Blue crosses red, going up. Enter on the opening of the next period immediately following the close of the signal.
Short = Red crosses blue, going up. Enter on the opening of the next period immediately following the close of the signal.
Settings
There is only one setting for the Vortex Indicator;the VI_Length. The default setting is 14 period.
**VI_Length: Similar to the “period” of a moving average, this setting determines the number of periods used for data collection.**
Testing…Testing…Testing
Remember, comprehensive analysis is strongly suggested, and we advocate backwards and forward testing indicators or systems prior to trading actual funds. We propose conducting your tests on the following five pairs.
EUR/USD
AUD/NZD
EUR/GBP
AUD/CAD
CHF/JPY
If it doesn’t work on these five pairs, chances are it won’t work on other pairs. This is not an absolute, but we’ve found this rule is reliable in most cases.
We’ve added two other pairs to our testing sequence based on feedback we’ve received from our community. They are the:
BTC/USD (Bitcoin/US Dollar)
XAU/USD (Gold/US Dollar)
Timeframes and Results
In our initial test, we’ll run theVortex Indicator Indicator on the EUR/USD, t he BTC/USD and XAU/USD using the default settings across the daily and 4-hour timeframes on the MT4 strategy tester. We use the fast method of testing the indicator to get a general idea; however, you may also run the tick-by-tick data set for a more precise result (which takes considerably more time).
As No Nonsense Traders – and therefore Swing Traders, we will not examine shorter time frames in these studies.We will also run an additional test, using different values for the settings, to analyze which one may work better and examine the following results:
Total trades
Win/Loss ratio
ROI (return on investment)
There are other metrics included in the strategy tester report, which can be compared, but these three metrics provide the necessary gauge to make quick decisions as to the usefulness of a particular indicator and its settings.
Next, for comparison, we’ll explore the following;
Daily – 1 year
4-hour – 3 months
The reason exceptionally long (or short) testing periods are not included is due to changing market conditions, which might return irrelevant information. A balance of statistically significant data is necessary for accurate results.
And the Outcome…
Below are the spreadsheets listing the results from our tests.
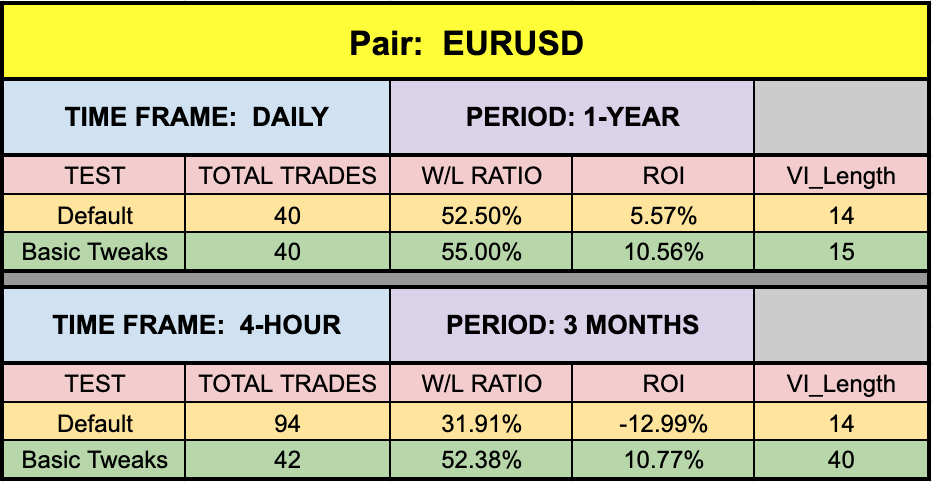
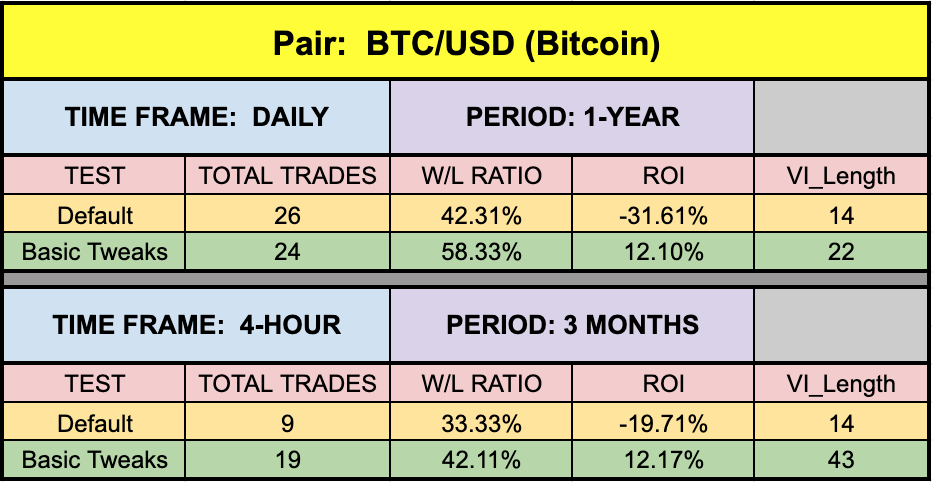
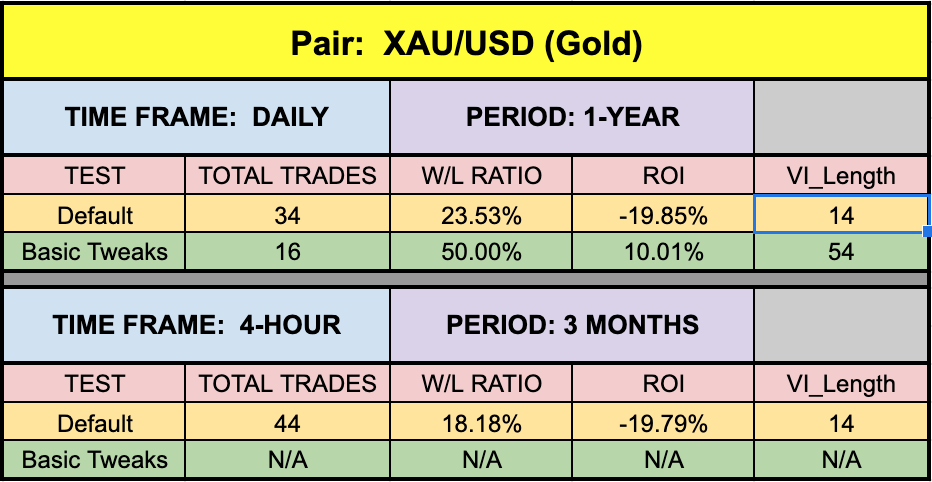
The green highlighted rows represent “basic tweaks” on the settings which returned better results. Are these the best? Not necessarily. Given that variables including testing date range and broker data are different from person to person, you may find better settings.
*NOTE: During the three-month period where we tested the XAU/USD (Gold) on the 4-hour time frame, there were no possible combination of settings that returned a positive ROI. This was first discussed in theFisher No-Repaint blogand again in VP’s corresponding indicator profileYouTube Video.
It is What it is…
This happens from time to time, and in that case, just move on to another indicator if that’s what you trade. It’s not a big deal. It’s just a part of trading and the fact that you know this exists, you’ll have the working knowledge that other traders may not be aware of.
Remember, the overall NNFX philosophy of taking profit, risk, and drawdown is that YOU are creating a system which YOU will be trading. Don’t let anybody else take that away from you. Part of the learning process is digging in and doing the work yourself. To learn more about these topics, check out the Advanced Course!
That beings said, the results we post in these blogs should never be considered specific trading advice.
***Note: Remember, never use just this one indicator as your decision of whether to open or close a trade. It should be part of a system.