[et_pb_section fb_built=”1″ _builder_version=”4.16″ background_image=”etl/posts/j_tpo-as-a-confirmation-indicator/hidden_images/Screen-Shot-2021-09-20-at-1.33.56-PM.png” global_colors_info=”{}”][et_pb_row _builder_version=”4.16″ background_size=”initial” background_position=”top_left” background_repeat=”repeat” custom_padding=”||26px|||” global_colors_info=”{}”][et_pb_column type=”4_4″ _builder_version=”4.16″ custom_padding=”|||” global_colors_info=”{}” custom_padding__hover=”|||”][et_pb_text _builder_version=”4.17.6″ background_color=”RGBA(0,0,0,0)” background_enable_image=”off” background_position=”top_left” custom_padding=”||0px|||” inline_fonts=”Roboto,Abril Fatface” global_colors_info=”{}”]
Welcome to the next Stonehill Forex Indicator Study. This research represents an investigative look into how and why some indicators work and some don’t work as well.
New Versus Old
In this study, we’re going to examine the J_TPO Indicator. This indicator was developed and coded into the Meta Trader universe in 2004 by a mystery coder (and/or trader) who remains anonymous to this day. There have been subsequent variations of this indicator which do have named authors; however, they’ve based their work off of the original source code.
Why is This One Different?
This indicator is a little different from what you might expect. Firstly, it is considered a volatility indicator (which we’ll talk about shortly). Second, volatility and volume are first cousins…but this is NOT a volume indicator because it crosses a fixed “zero line” and specifies volatility and direction (i.e., long & short). Third, it does not behave like, nor does it give signals like a volume indicator. If this sounds a little confusing, we’ll make it clear shortly.
Volatility Does Not Always Mean Choppy
Let’s cover some definitions first. The term “Volatility” can create market anxiety. Occasionally, we hear someone mutter, “The market’s volatile, so you’d better lie low and hold off trading…” or some variation there of. Volatility, by definition, is a quantitative measurement of the market’s activity based on prior data. We like volatility in the market. Without it, a dead market would not provide trading opportunities and would essentially be flat. We don’t like that.
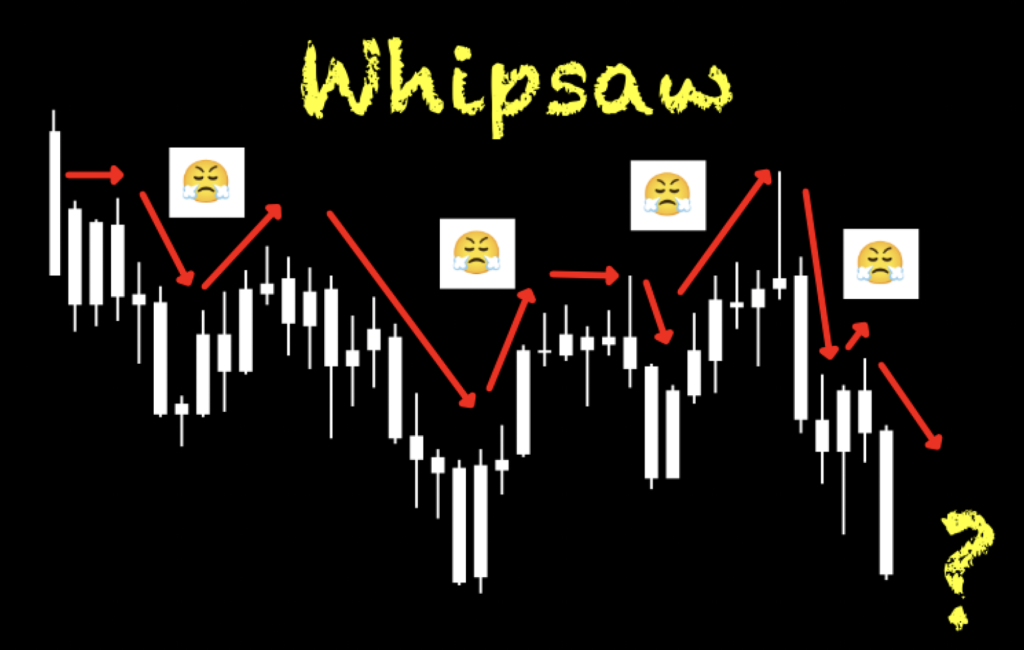
More Isn’t Always Better
Of course, excessive volatility does not provide a friendly trading environment either. Excessive and frequent price swings, also known as whipsaws (which we covered in the Normalized Volume blog), can be frustrating to say the least. This is why we advocate building an algorithm, which gives consideration across a “system” and not solely on signals from just one or two indicators.
(Remember me?)
A quick reminder… a “confirmation indicator” falls into the category of indicators that serve as an initial checkpoint after the baseline indicator provides you with a foundational signal. You’ll also notice that the J_TPO, is a “below chart” indicator, which helps keep your price chart free of those bothersome distractions. These concepts are explained in great detail in the Stonehill Forex Advanced Course HERE.
Advantages
The advantages of this particular confirmation indicator include;
-
Only has one setting to adjust
-
Indicates which direction the market is heading
-
Signals are easy to understand
Looking Brilliant!
Below is a screenshot of what the indicator looks like on the daily time frame. Note that we’ve changed the color of the candles to white to remove any emotional bias so that only the indicator is prominent. We also added the zero line (in yellow).
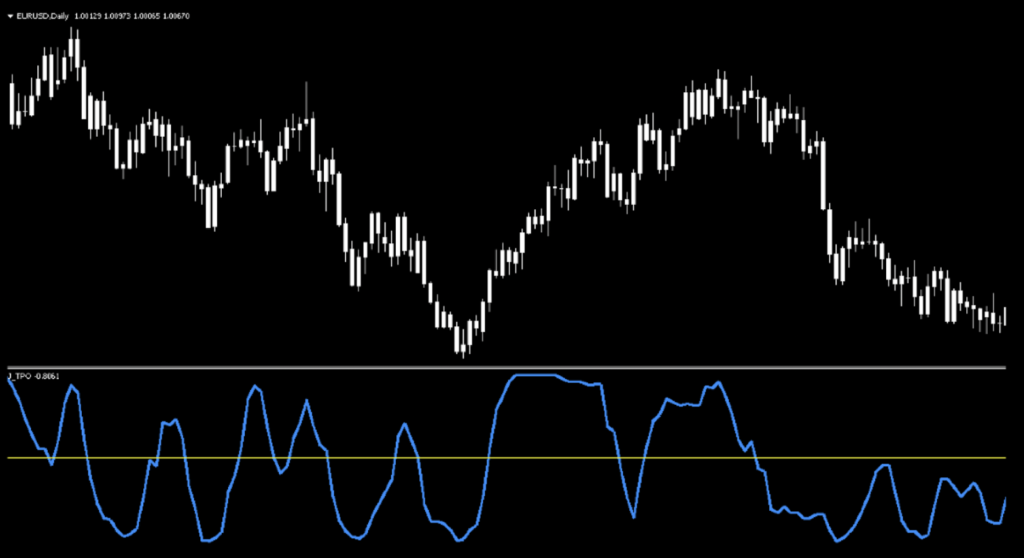
How it’s Used
Long Signal: Crossing and closing above zero indicates a long trade condition.
Short Signal: Crossing and closing below the zero line indicates that price has momentum to the downside and a short trade may be on your near horizon.
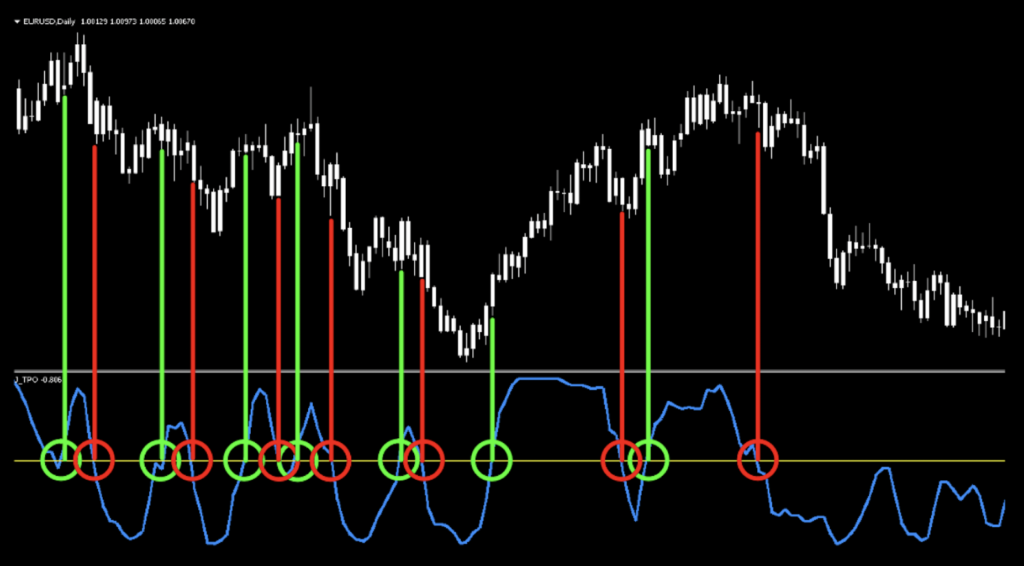
Chart, Marked Up
See the marked up chart below. Where the indicator line crossed below zero, a red circle and line were drawn to indicate a short signal, and where a green circle and line were drawn indicated a long signal.
Settings
There is only one setting for this indicator, “Len”. This is the number of periods to determine the volatility within that time frame. The default value is 14.
Testing…Testing…Testing
Remember, comprehensive analysis is strongly suggested, and we advocate backwards and forward testing indicators or systems prior to trading actual funds. We propose conducting your tests on the following five pairs.
EUR/USD
AUD/NZD
EUR/GBP
AUD/CAD
CHF/JPY
If it doesn’t work on these five pairs, chances are it won’t work on other pairs. This is not an absolute, but we’ve found this rule is reliable in most cases.
We’ve added two other pairs to our testing sequence based on feedback we’ve received from our community. They are the:
BTC/USD (Bitcoin/US Dollar)
XAU/USD (Gold/US Dollar)
Timeframes and Results
In our initial test, we’ll run the J_TPOIndicator on the EUR/USD, t he BTC/USD and XAU/USD using the default settings across the daily and 4-hour timeframes on the MT4 strategy tester. We use the fast method of testing the indicator to get a general idea; however, you may also run the tick-by-tick data set for a more precise result (which takes considerably more time).
As No Nonsense Traders – and therefore Swing Traders, we will not examine shorter time frames in these studies.We will also run an additional test, using different values for the settings, to analyze which one may work better and examine the following results:
Total trades
Win/Loss ratio
ROI (return on investment)
There are other metrics included in the strategy tester report, which can be compared, but these three metrics provide the necessary gauge to make quick decisions as to the usefulness of a particular indicator and its settings.
Next, for comparison, we’ll explore the following;
Daily – 1 year
4-hour – 3 months
The reason exceptionally long (or short) testing periods are not included is due to changing market conditions, which might return irrelevant information. A balance of statistically significant data is necessary for accurate results.
And the Outcome…
Below are the spreadsheets listing the results from our tests.
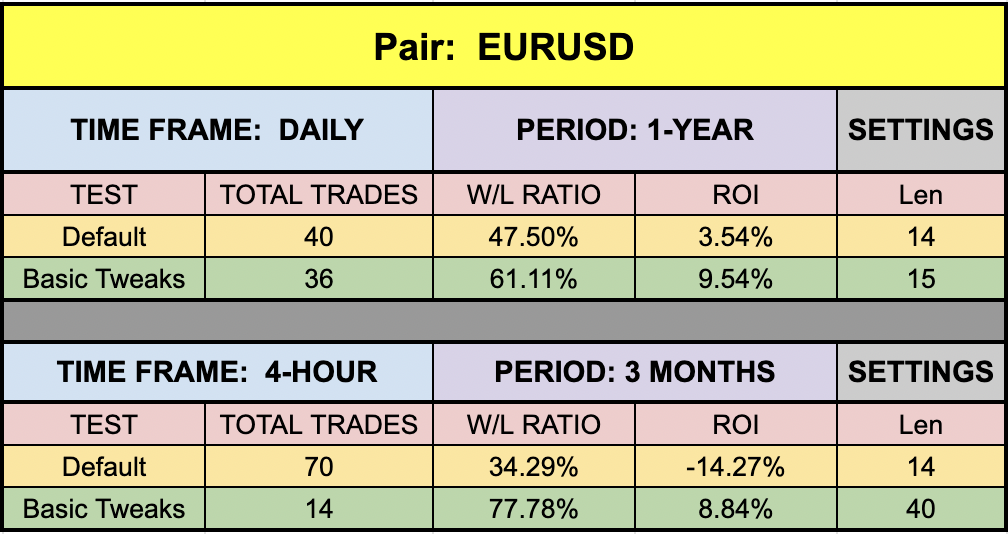
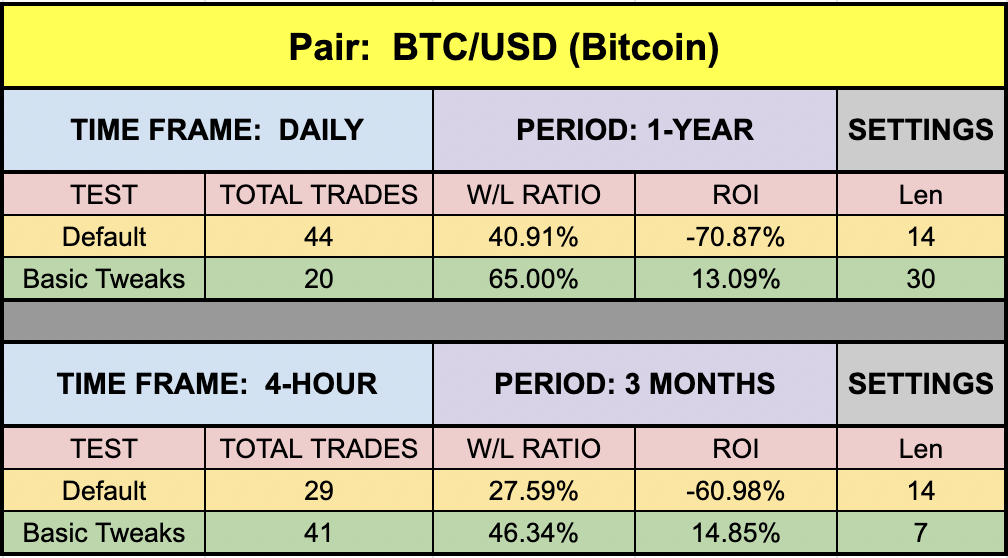
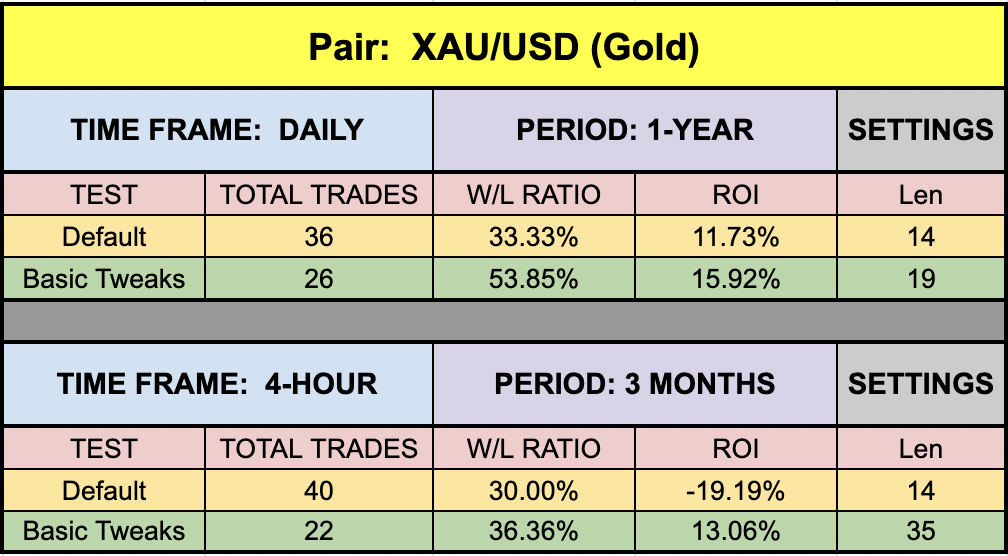
The green highlighted rows represent “basic tweaks” on the settings which returned better results. Are these the best? Not necessarily. Given that variables including testing date range and broker data are different from person to person, you may find better settings.
Trust in Yourself
Remember, the overall NNFX philosophy of taking profit, risk, and drawdown is that YOU are creating a system which YOU will be trading. Don’t let anybody else take that away from you. Part of the learning process is digging in and doing the work yourself. To learn more about these topics, check out the Advanced Course!
That beings said, the results we post in these blogs should never be considered specific trading advice.
***Note: Remember, never use just this one indicator as your decision of whether to open or close a trade. It should be part of a system.